PlotState
PlotState[EquilibriumObject]⟹Plot
constructs a PieChart describing the relative concentrations of each species in EquilibriumObject.
PlotState[State]⟹Plot
constructs a PieChart describing the relative concentrations of each species in State.
PlotState[Concentrations,Species]⟹Plot
constructs the PieChart given lists of Concentrations and Species.
Details
Input
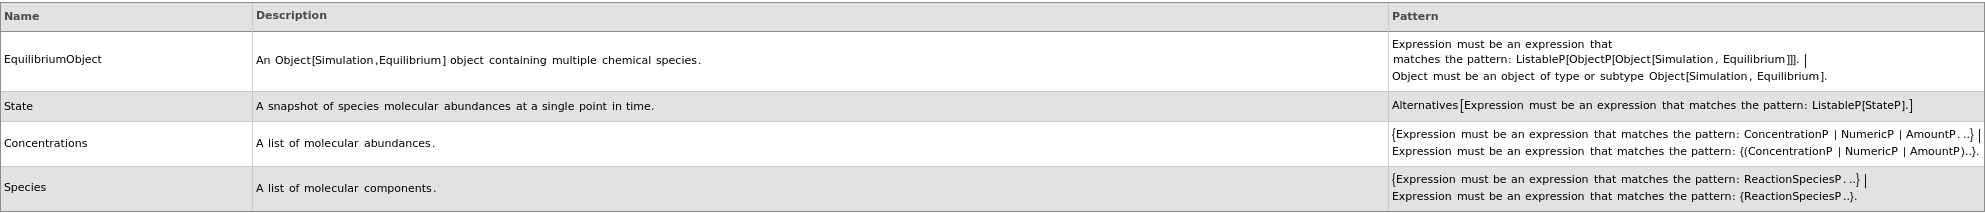
Output

Image Format Options

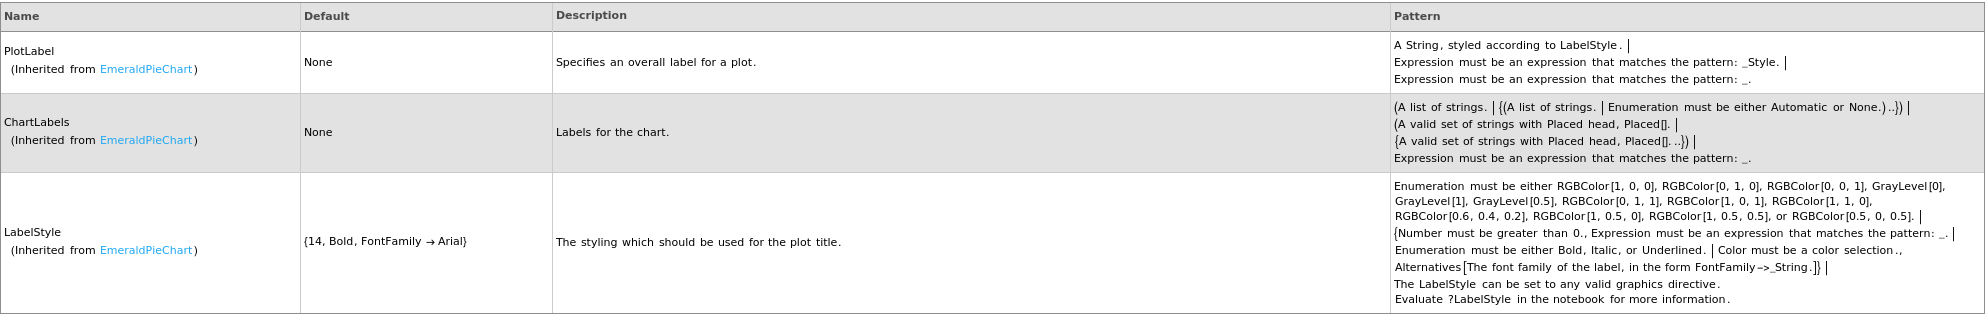
Plot Labeling Options
Plot Style Options
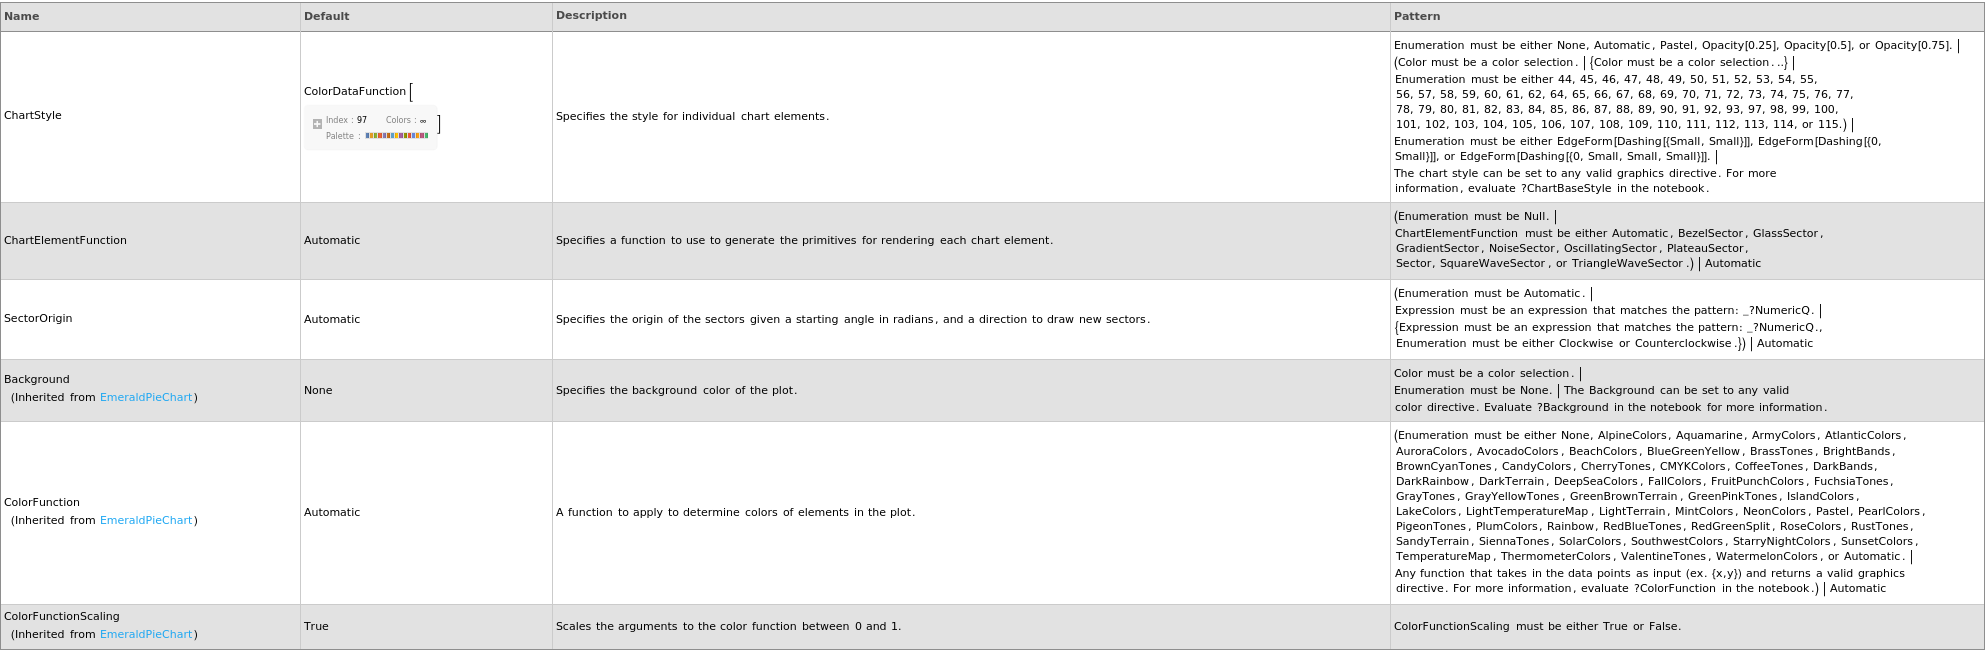
General Options

Examples
open allclose allBasic Examples (4)
Options (4)

Last modified on Thu 21 Aug 2025 11:25:30