PlotTroubleshootingDistributions
PlotTroubleshootingDistributions[]⟹Figure
displays troubleshooting distribution of all types of Protocols if no type is specified.
PlotTroubleshootingDistributions[Types]⟹Figure
displays troubleshooting distribution of Protocols if their types are Types.
PlotTroubleshootingDistributions[Types,TimeSpan]⟹Figure
displays troubleshooting distribution of Protocols if their types are Types during TimeSpan.
PlotTroubleshootingDistributions[Types,StartTime,EndTime]⟹Figure
displays troubleshooting distribution of Protocols if their types are Types from StartTime to EndTime.
Details
-
NoProtocols No protocols with specified protocol types could be found within the specified time period. If you aren't already doing so you may want to specify the exact protocol types and dates of interest using PlotTroubleshootingDistributions[protocolType, startDate, endDate].
Input
Output

Messages
Examples
Basic Examples (4)
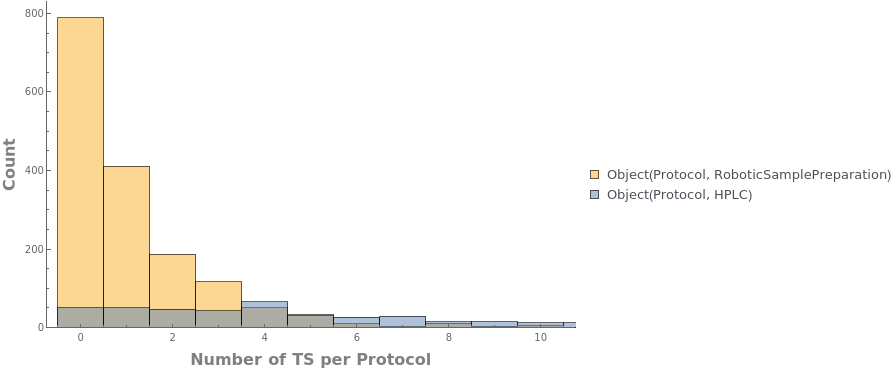
Create a histogram of troubleshooting for protocol type RSP and HPLC:

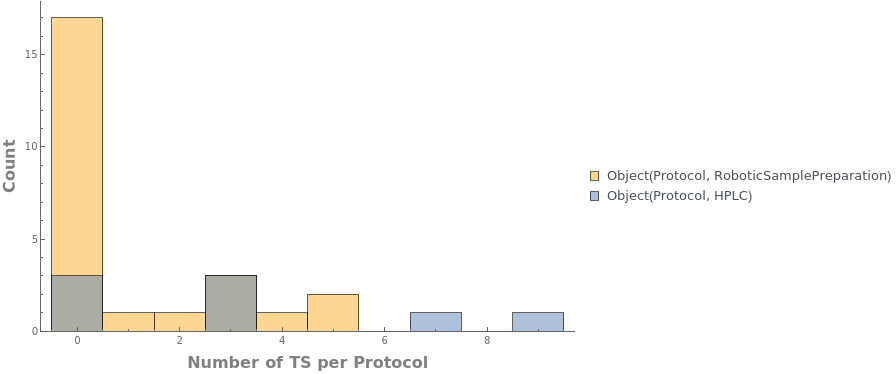
Create a histogram of troubleshooting for protocol type RSP and HPLC between last 2 month to last month:

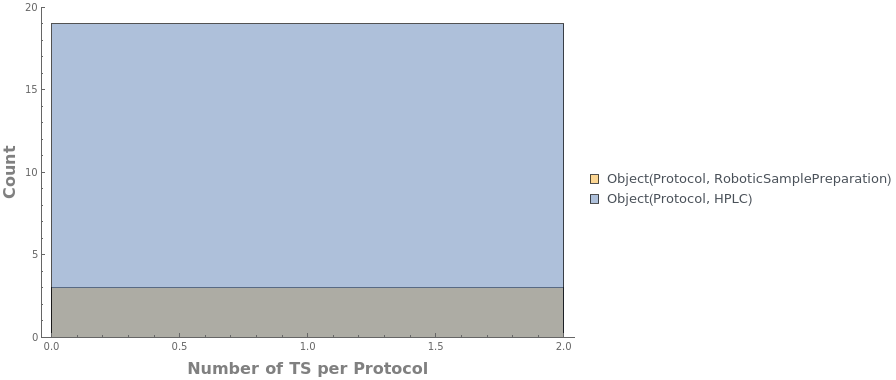
Create a histogram of troubleshooting for protocol type RSP and HPLC for the last week

Create a histogram of troubleshooting with no input:

