AnalyzeColonies
AnalyzeColonies[MicroscopeData]⟹ColoniesAnalysis
counts the colonies on solid media imaged in MicroscopeData. This function classifies and locates the colonies based on a selected feature, which can be one of the following: Diameter, Regularity, Circularity, Isolation, Fluorescence, and BlueWhiteScreen. Additionally, classification can be based on a combination of desired features (MultiFeatured), or all colonies defined with Min/MaxDiameter, Min/MaxCircularityRatio, Min/MaxRegularityRatio, MinColonySeparation and Margin (AllColonies). For more information see documentation on colony population Unit Operations: Diameter, Isolation, Regularity, Circularity, Fluorescence, BlueWhiteScreen, MultiFeatured, and AllColonies. The generated ColoniesAnalysis can be used to isolate these colonies in fresh media in subsequent protocols, such as colony picking.
Details
- The diameter of a colony is the diameter of a disk with the same area as the colony.
- The separation or isolation is the shortest distance from the boundary of the colony to the boundary of another.
- The regularity is the ratio of the area of the colony to the area of a circle with the same perimeter.
- The circularity is the ratio of the minor axis to the major axis of the best fit ellipse.
- BlueWhiteScreen features the average pixel value inside the colony boundary from a BlueWhiteScreen image generated using a blue-light blocking filter.
- Fluorescence features the average pixel value inside the colony boundary from an image generated using an excitation wavelength and emission filter.
- Available fluorescence excitation/emission pairs are 377nm/447nm, 457nm/536nm, 531nm/593nm, 531nm/624nm, and 628nm/692nm. They are respectively referred to as VioletFluorescence, GreenFluorescence, OrangeFluorescence, RedFluorescence, and DarkRedFluorescence.
- The picking algorithm filters the colonies using the min and max bounds of diameter, regularity, circularity, and isolation outside of the margin. Then the Populations option is used to group colonies into populations using the Diameter, Isolation, Regularity, Circularity, Fluorescence, BlueWhiteScreen, MultiFeatured, or AllColonies Unit Operation.
- The counting algorithm identifies the singleton colonies on the plate and then estimates the number of colonies in colony clusters by dividing each cluster by the average area of a singleton. As a result, the total estimated colonies can be fractional.
Input

Output

Characterization Options
Filtering Options
Picking Options

General Options

Examples
open allclose allBasic Examples (4)
By default, AnalyzeColonies selects the fluorescent colonies:
Set AnalysisType option to Count to estimate the total number of colonies on the plate, including clusters of colonies. Set Populations to All to count the colonies filtered by the Min and Max constraints of diameter, separation, circularity, and regularity:
Set Populations to Regularity to select the colonies with the highest regularity ratio:
Set Select option to {All} to select all colonies that meet the overall constraints on diameter, separation, circularity, and regularity:
Additional Examples (4)
A list of colonies appearance data can be input:
For BlueWhiteScreen image, if orientation of the raw image is different than BrightField image, raw image is adjusted before calculating colonies:
For Diameter, Isolation, Regularity, and Circularity the Populations option will by default select the top half of colonies when ordered by that feature and then keep the 10 that score the highest:
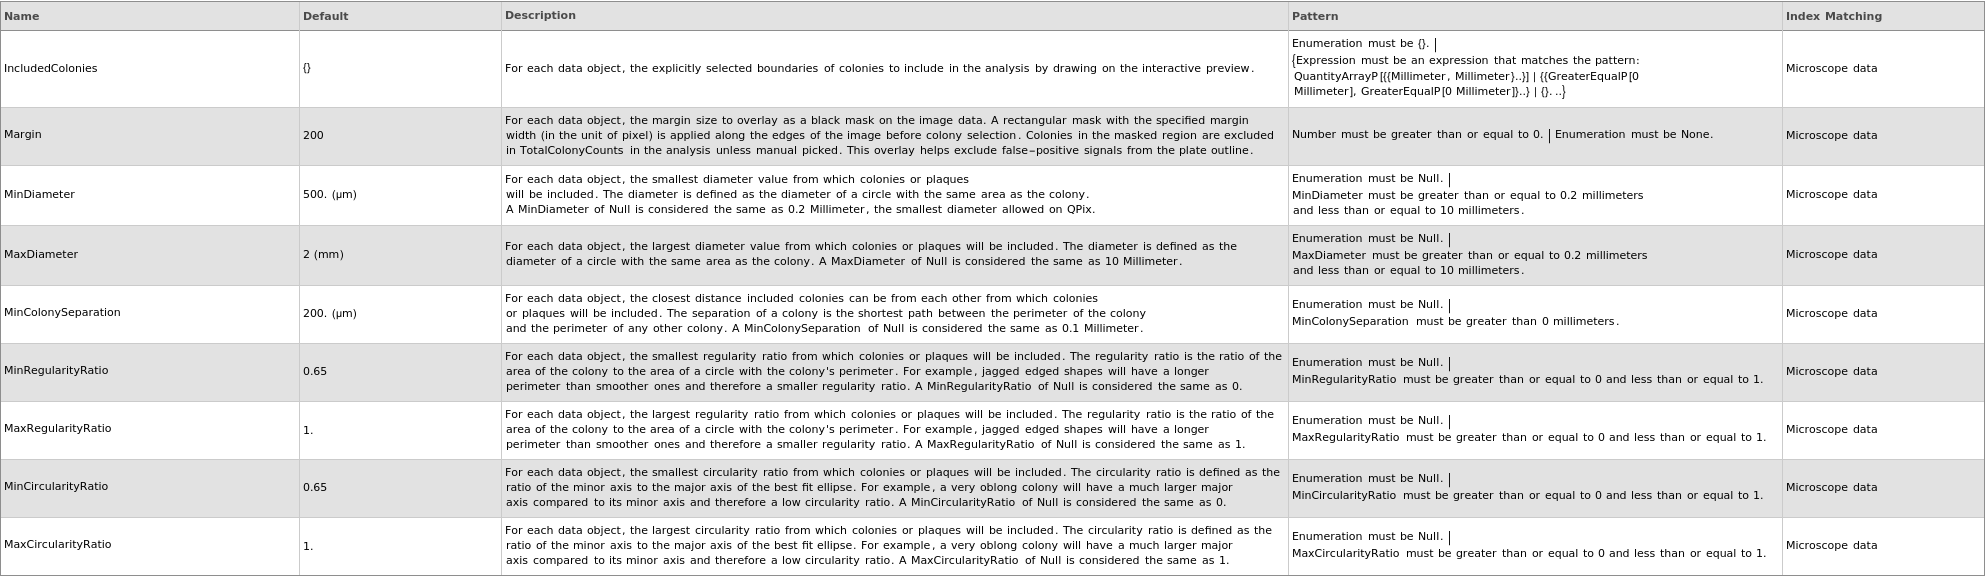
For MinDiameter, MaxDiameter, MinColonySeparation, MinRegularityRatio, MaxRegularityRatio, MinCircularityRatio, and MaxCircularityRatio, specified Null is taken as the corresponding limit value allowed for the option:
Options (23)
AnalysisType (1)
IncludedColonies (1)
ManualPickTargets (1)
Margin (2)
MinColonySeparation (1)
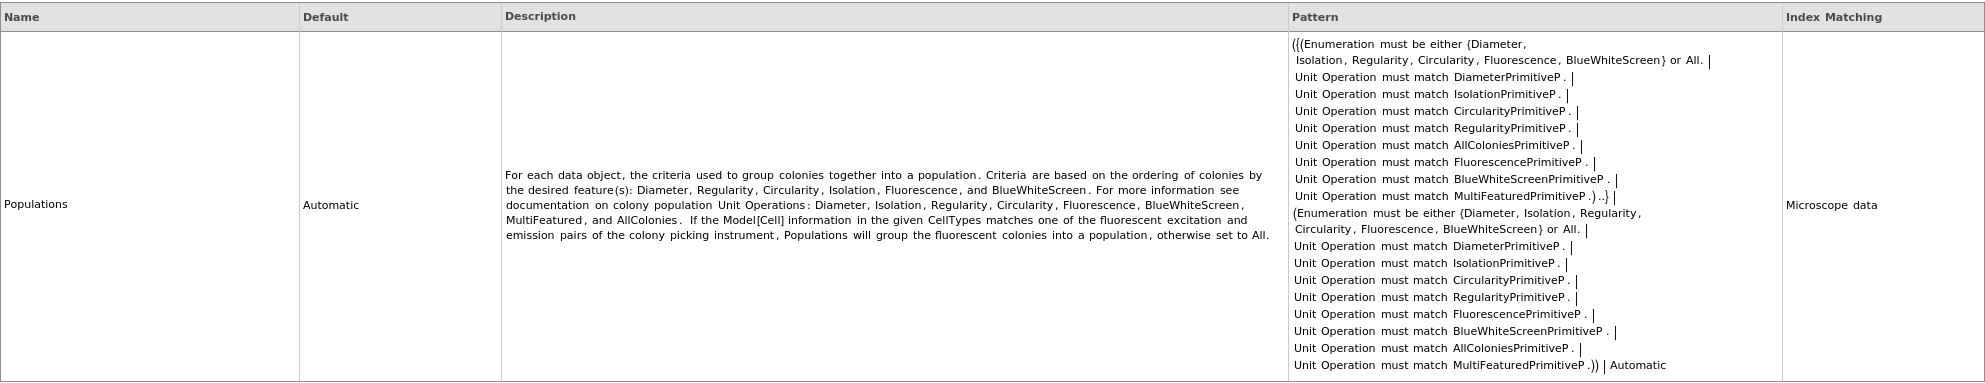
Populations (11)
A very large threshold value will select no colonies:
Exclude a colony automatically included by the algorithm by specify a coordinate inside the boundary:
Include a colony not automatically included by the algorithm by specify a coordinate inside the boundary:
Set BlueWhiteScreen Unit Operation to pick non-blue colonies:
Set Select in the primitive to BelowThreshold to select colonies lower than the specified cutoff:
Set Select to Negative in the Fluorescence Unit Operation to pick non-fluorescing colonies:
Set the NumberOfColonies option to 20 in the Diameter unit operation to keep at most 20 of the largest colonies:
Specify the NumberOfDivisions to 10 to partition the colonies based on the feature into 10 groups. Then set Select to Min and NumberOfColonies to All to keep the colonies from the smallest diameter partition:
Use PopulationName to name a population for ease of tracking:
Use the MultiFeatured primitive to intersect colonies from multiple selections. In this case overlap the Fluorescing colonies with the larger colonies:
Use threshold with Diameter, Regularity, Circularity, or Isolation to pick colonies with specific properties:


