PlotCapillaryGelElectrophoresisSDS
PlotCapillaryGelElectrophoresisSDS[DataObject]⟹Plot
generates a graphical plot of the data stored in a CapillaryGelElectrophoresisSDS data object.
PlotCapillaryGelElectrophoresisSDS[Protocol]⟹Plot
creates a Plot of the data objects found in the Data field of Protocol.
PlotCapillaryGelElectrophoresisSDS[Data]⟹Plot
generates a graphical plot of the provided CapillaryGelElectrophoresisSDS data.
Details
Input

Output

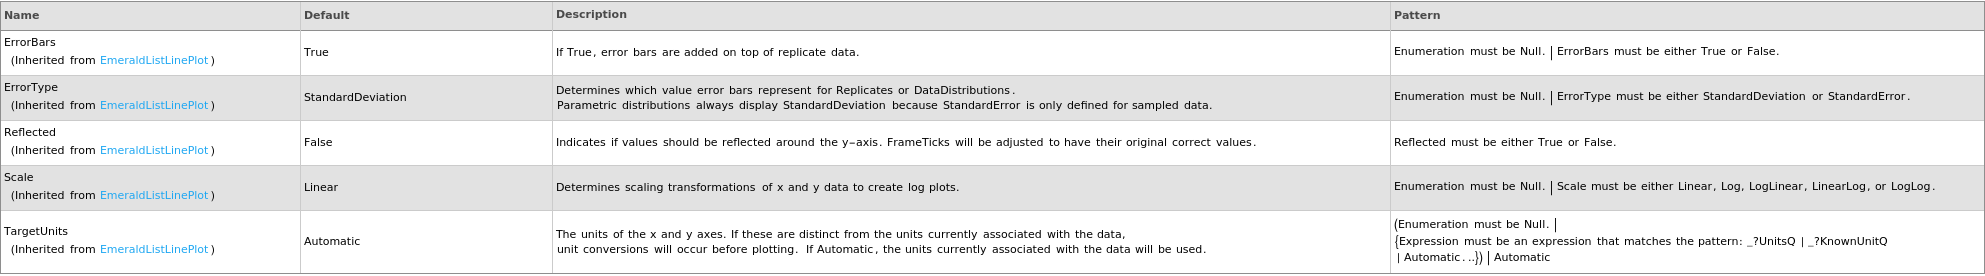
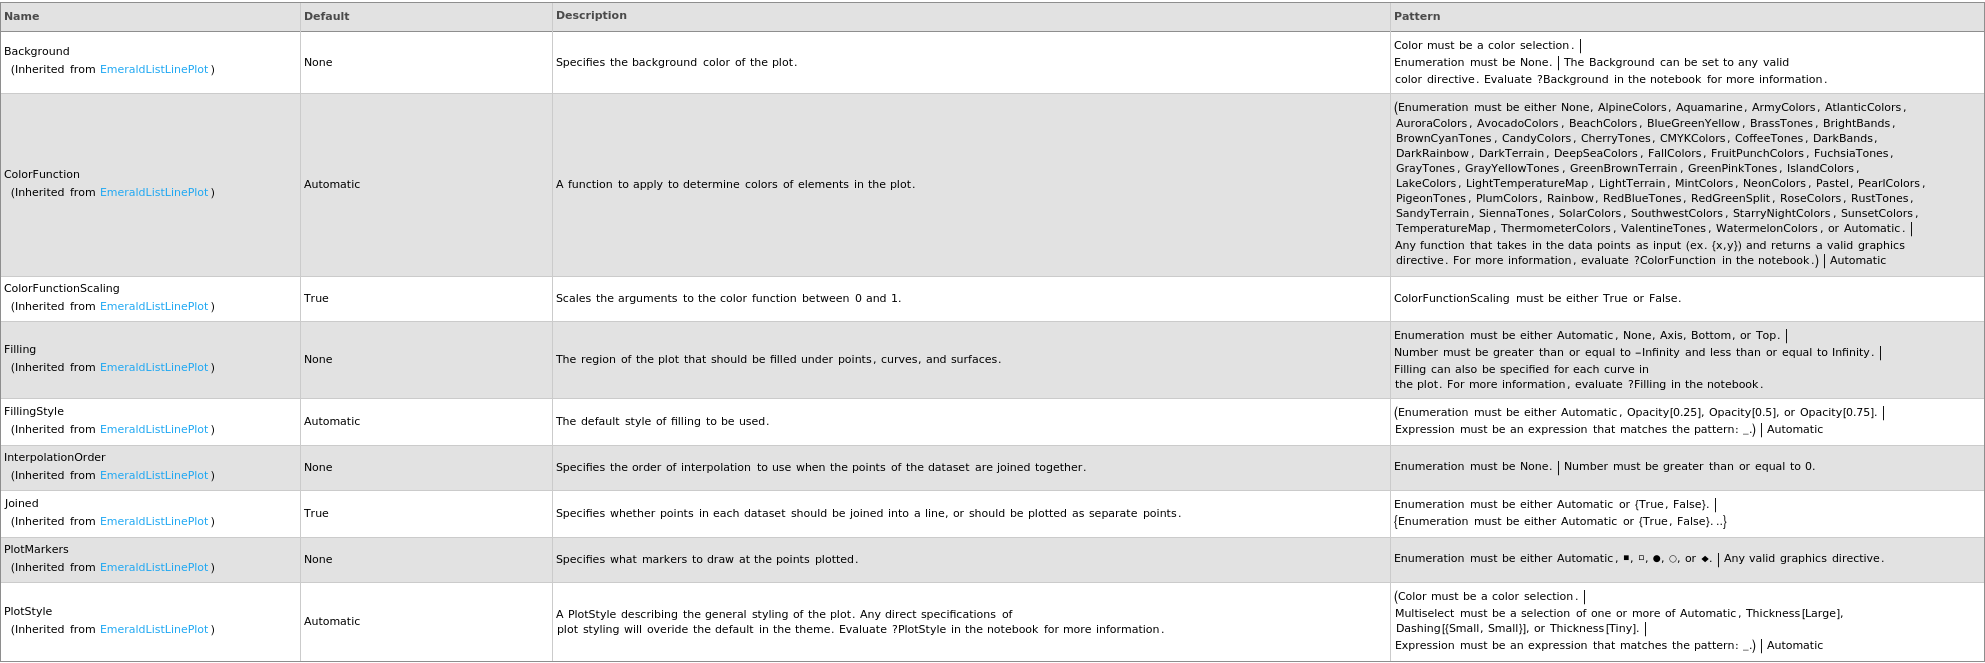
CapillaryGelElectrophoresisSDS Options

Data Specifications Options
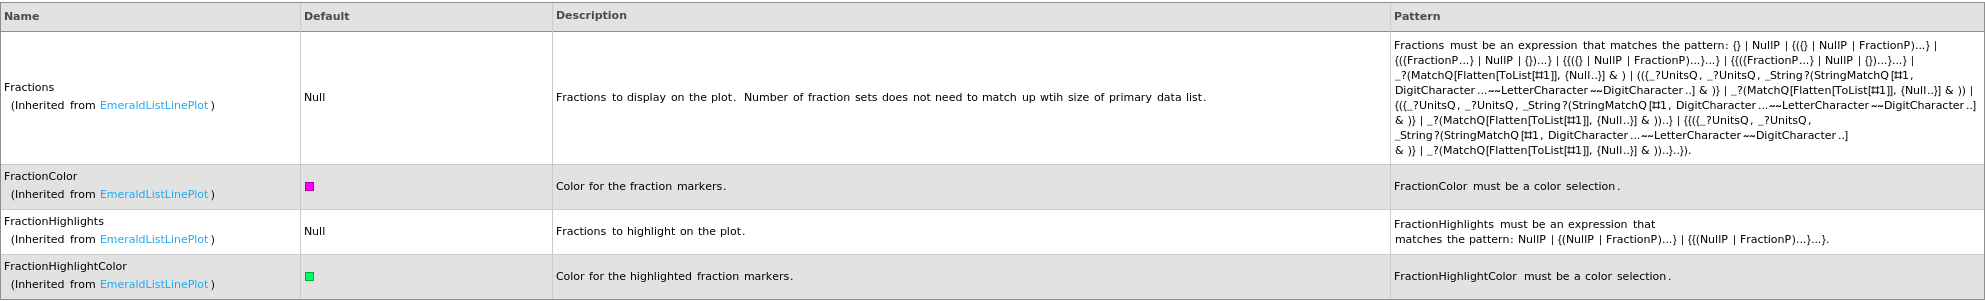
Fractions Options
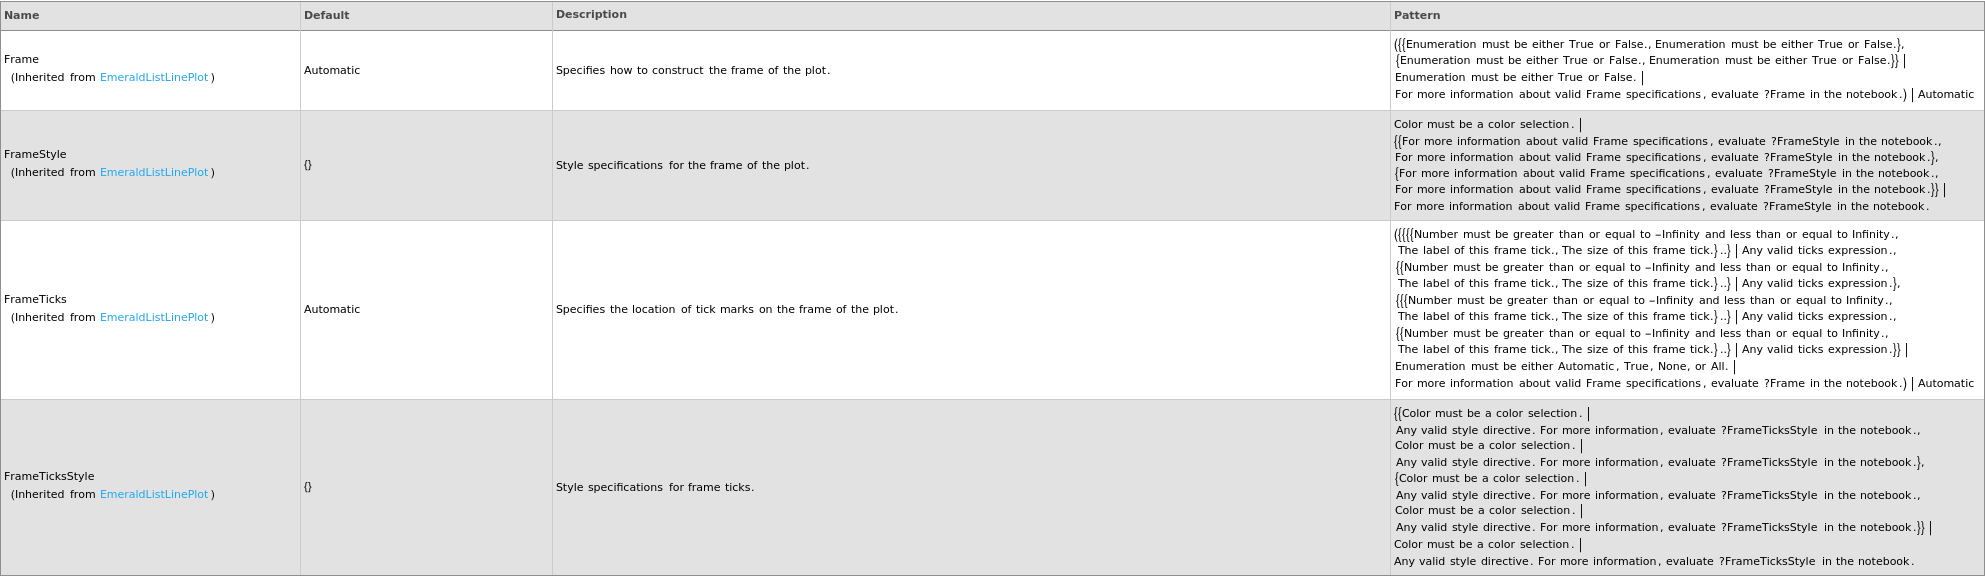
Frame Options
Grid Options
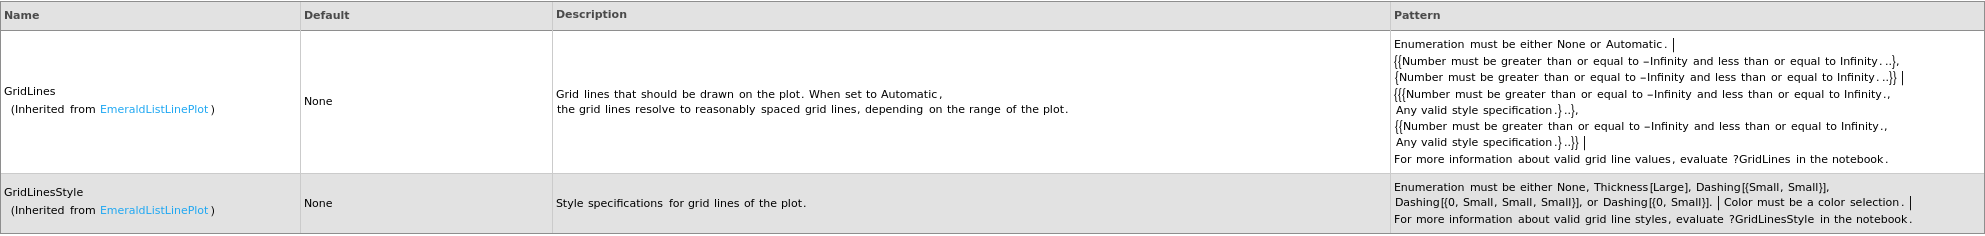
Image Format Options

Ladder Options

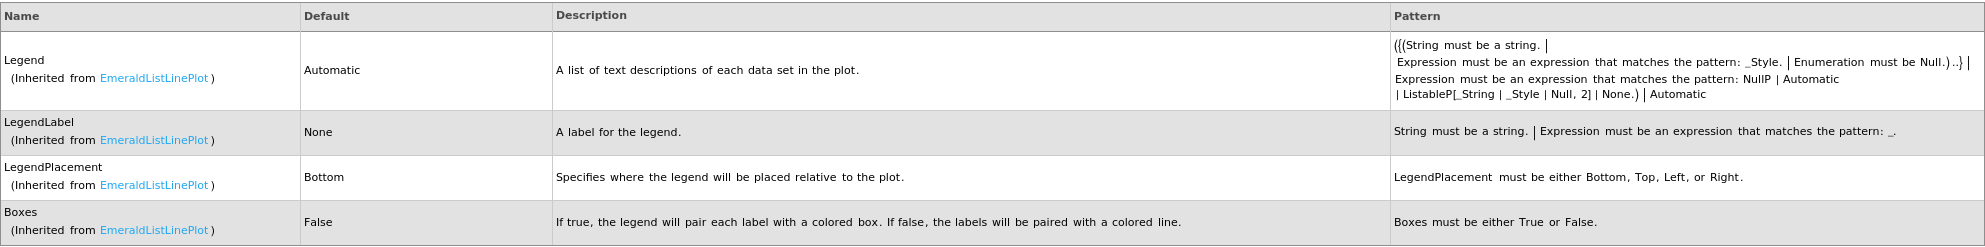
Legend Options
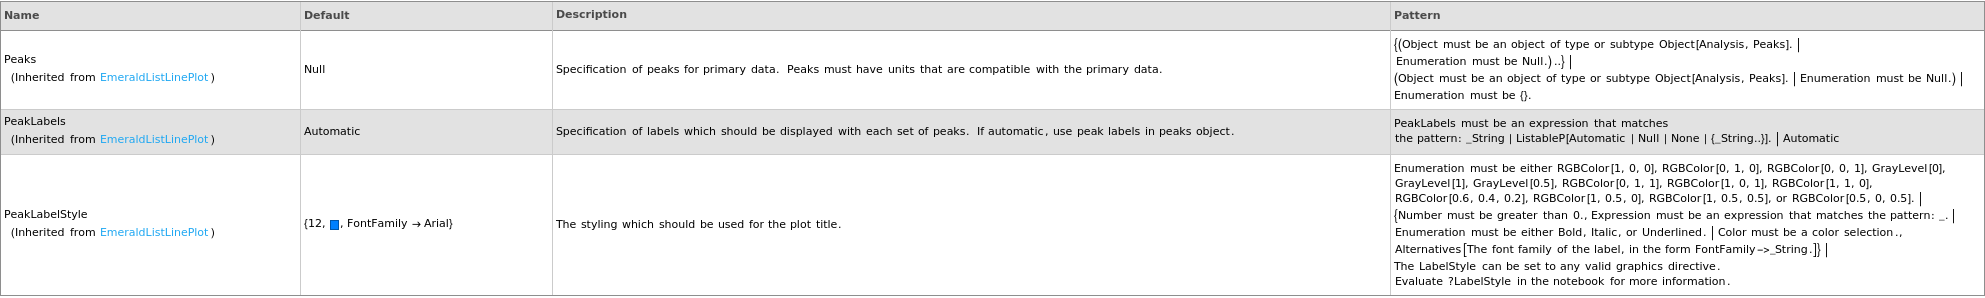
Peaks Options
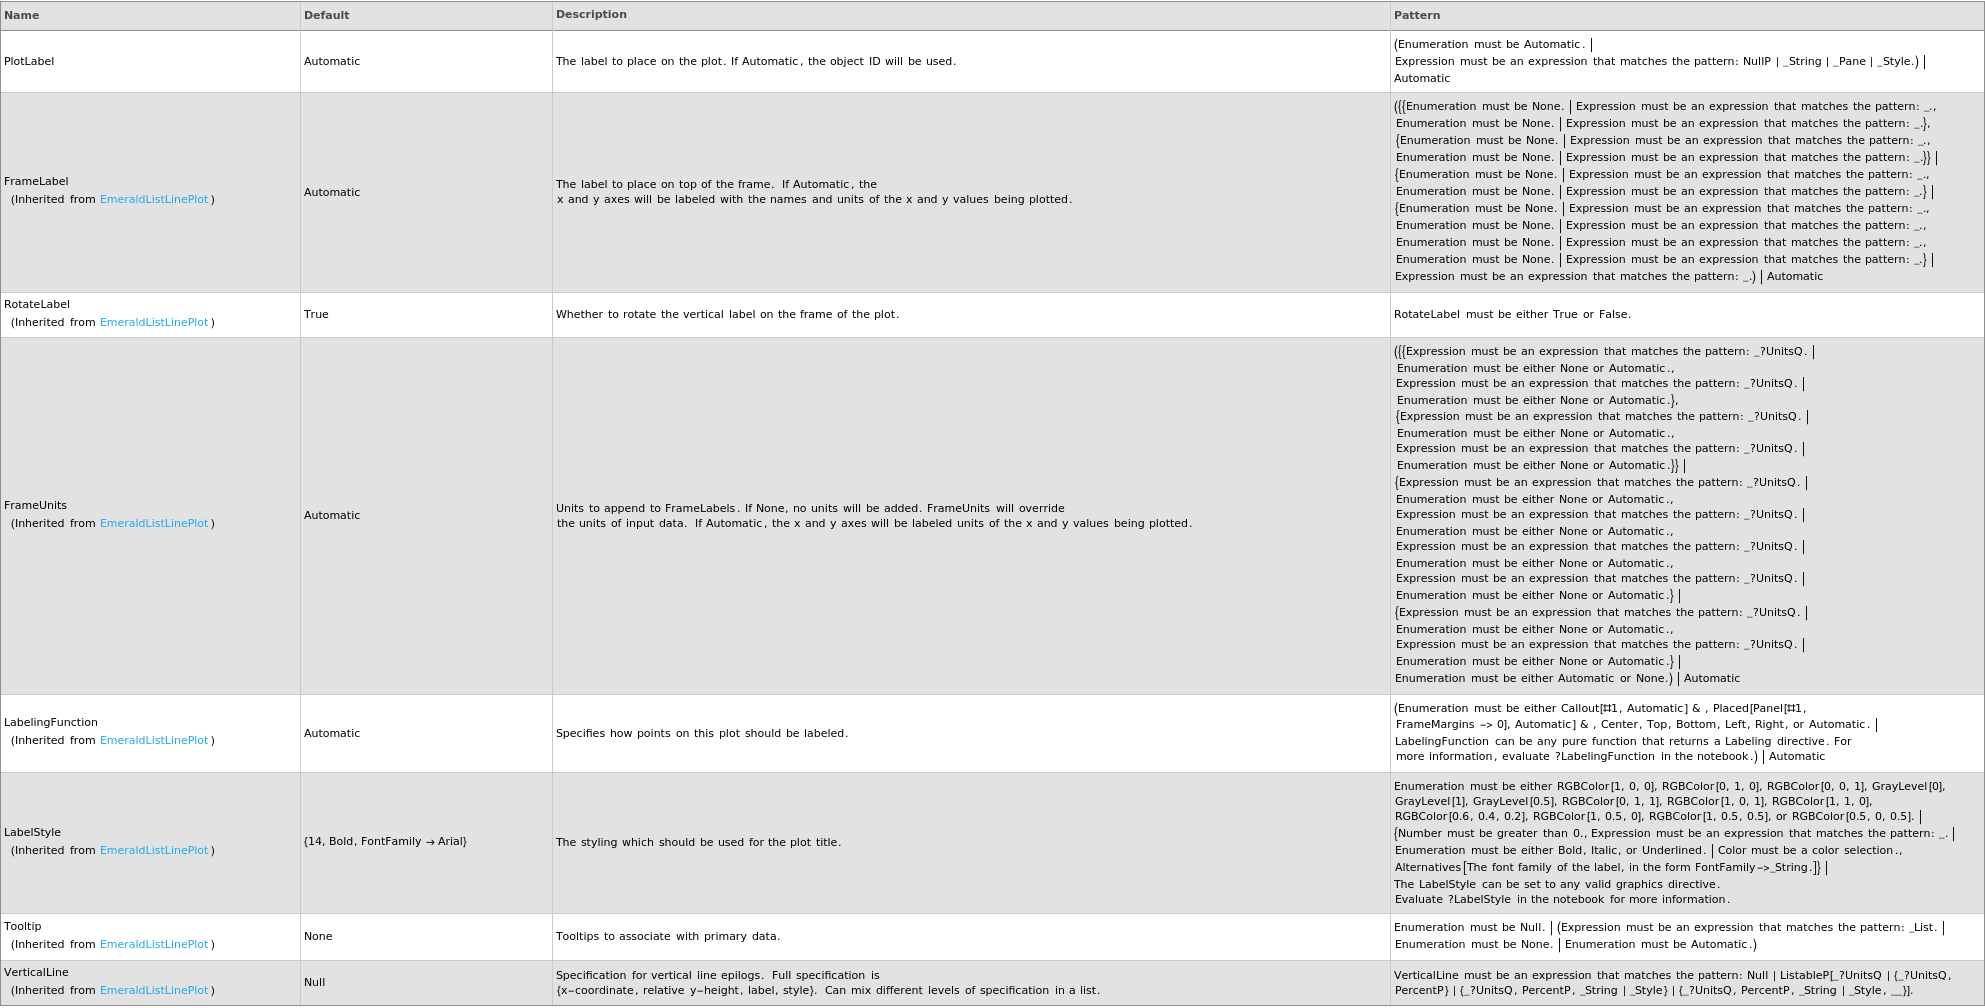
Plot Labeling Options
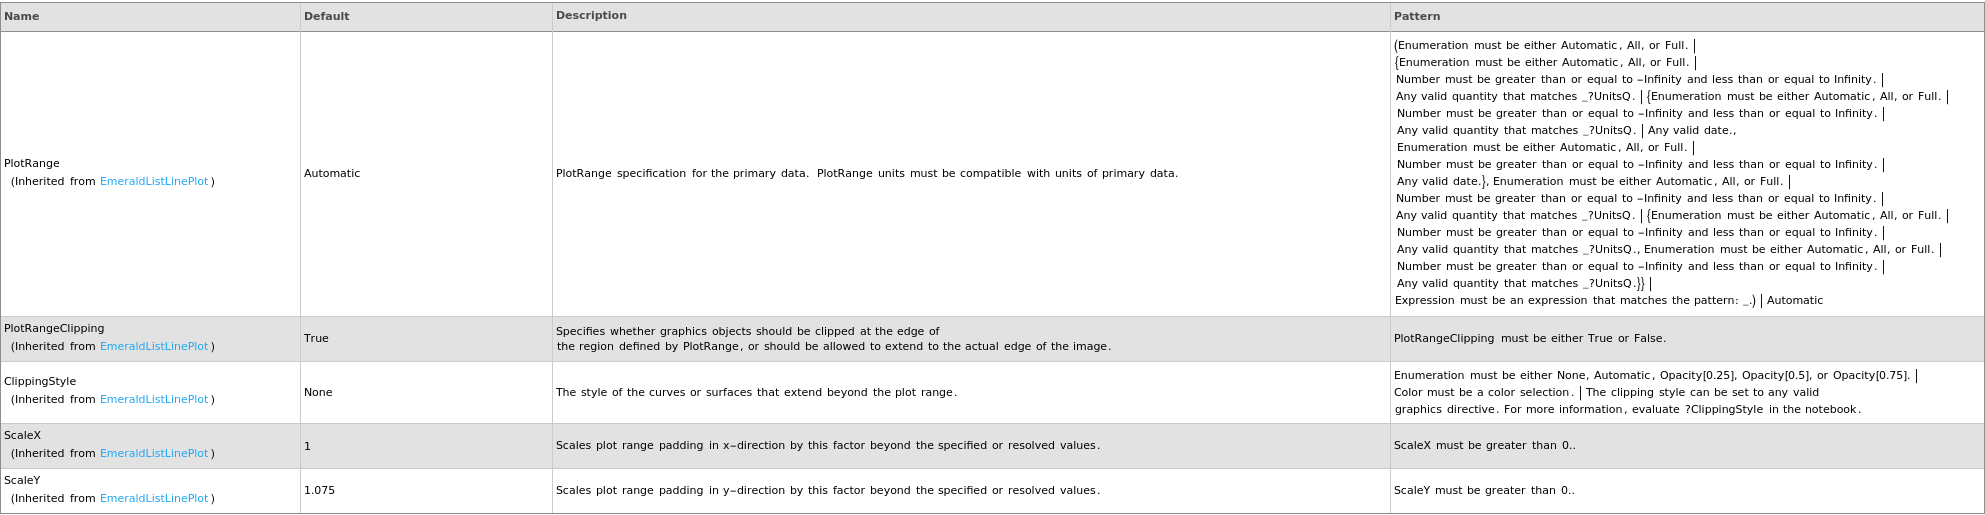
Plot Range Options
Plot Style Options
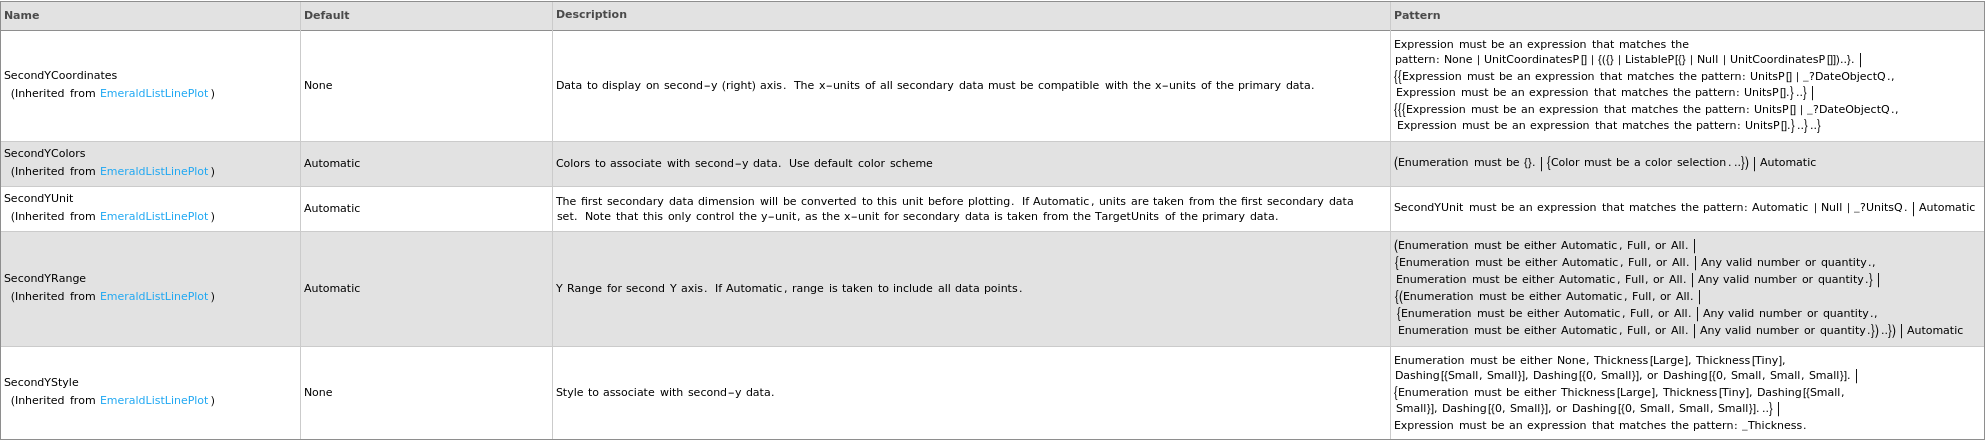
Secondary Data Options
General Options

Examples
open allclose allBasic Examples (6)
If peak-picking has already been done on input data, set PrimaryData to RelativeMigrationData to plot peaks relative to an internal standard:
Plots capillary gel electrophoresis when given a CapillaryGelElectrophoresisSDS protocol object:
Plots capillary gel electrophoresis when given a list of XY coordinates representing the spectra:
Plots capillary gel electrophoresis when given an CapillaryGelElectrophoresisSDS data link:
Plots capillary gel electrophoresis when given an CapillaryGelElectrophoresisSDS data object:
