PlotCapillaryIsoelectricFocusing
PlotCapillaryIsoelectricFocusing[DataObject]⟹Plot
generates a graphical plot of the data stored in a CapillaryIsoelectricFocusing data object.
PlotCapillaryIsoelectricFocusing[Protocol]⟹Plot
creates a Plot of the data objects found in the Data field of Protocol.
PlotCapillaryIsoelectricFocusing[Chromatograph]⟹Plot
generates a graphical plot of the provided CapillaryIsoelectricFocusing data.
Details
Input

Output

CapillaryIsoelectricFocusing Options
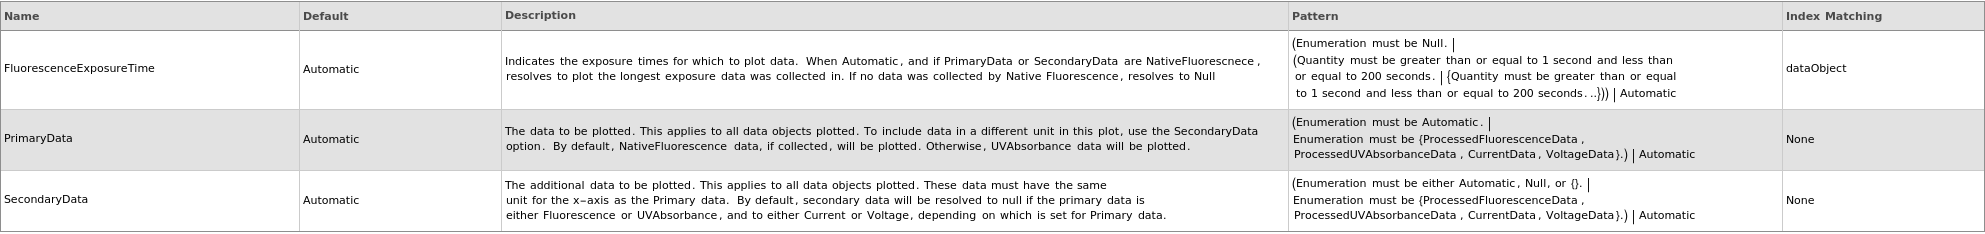
Data Specifications Options
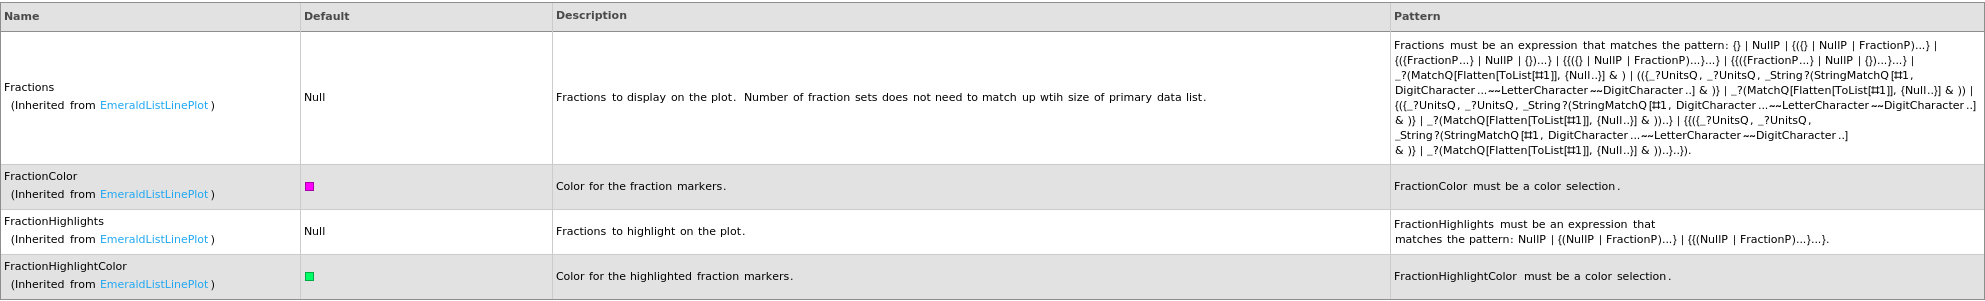
Fractions Options
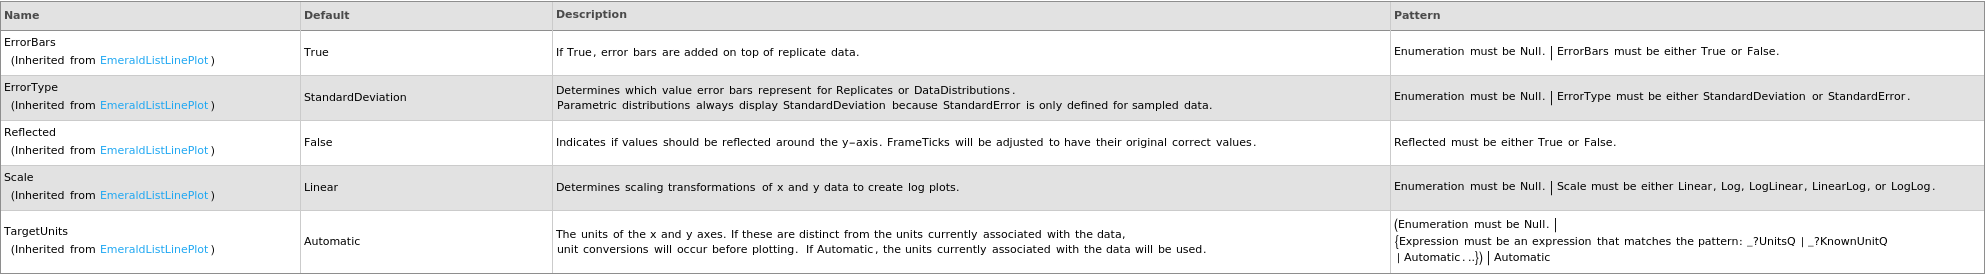
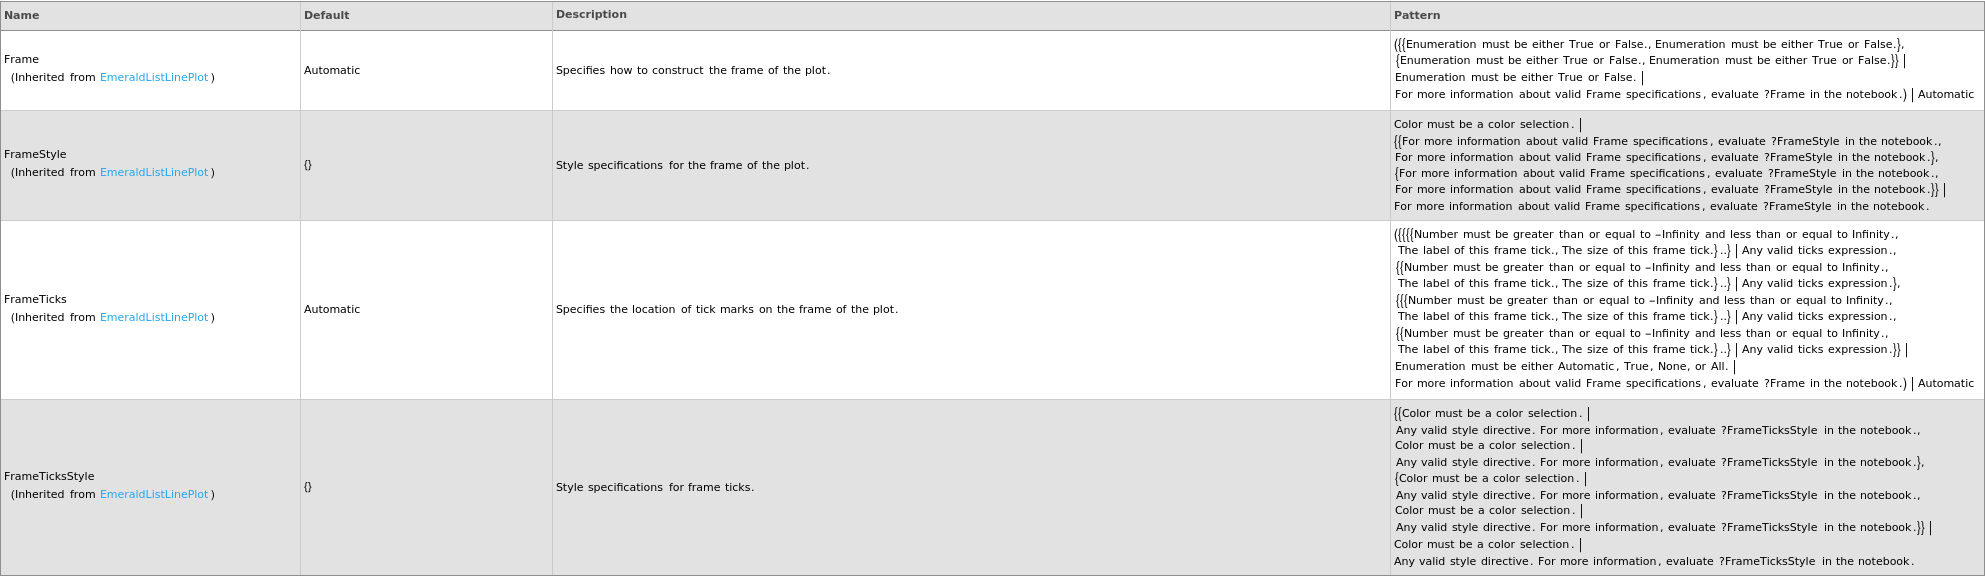
Frame Options
Grid Options
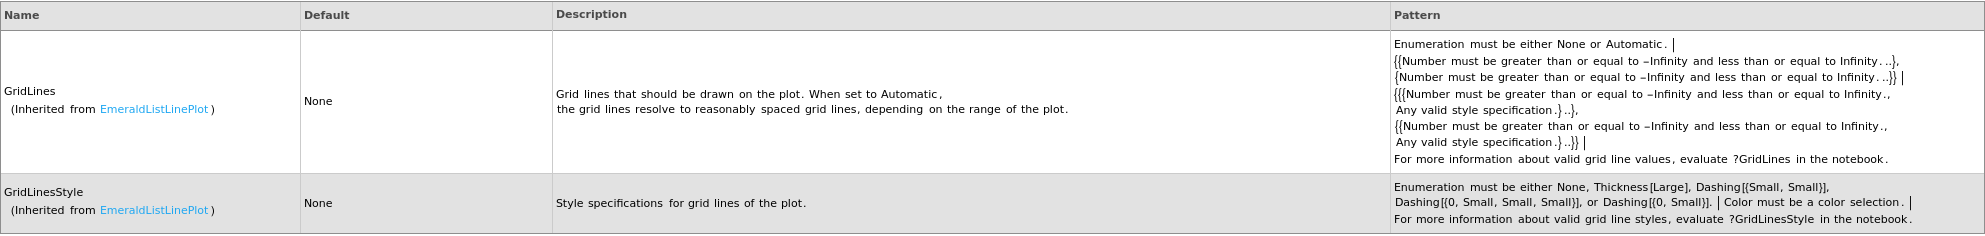
Image Format Options

Ladder Options

Legend Options

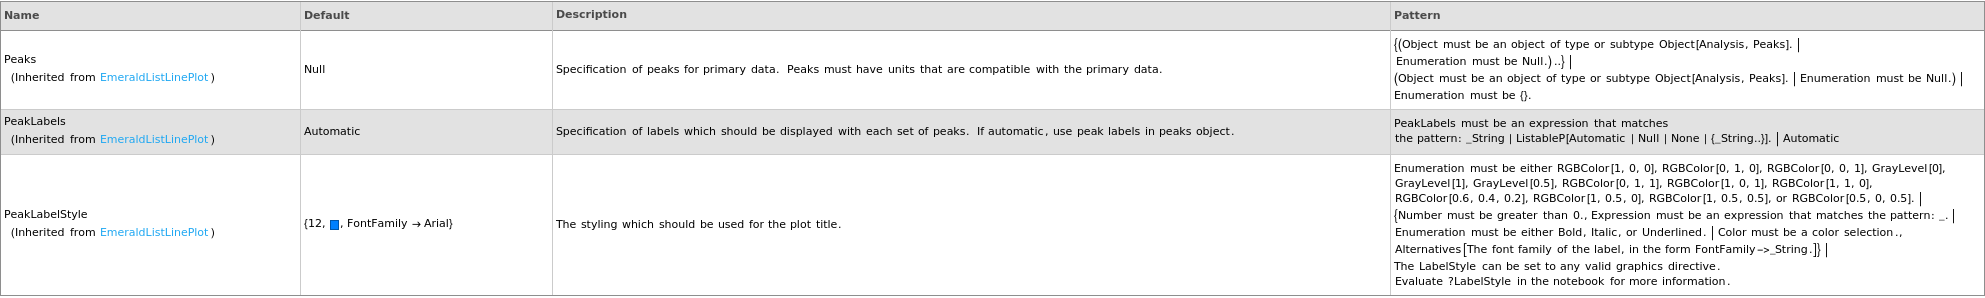
Peaks Options
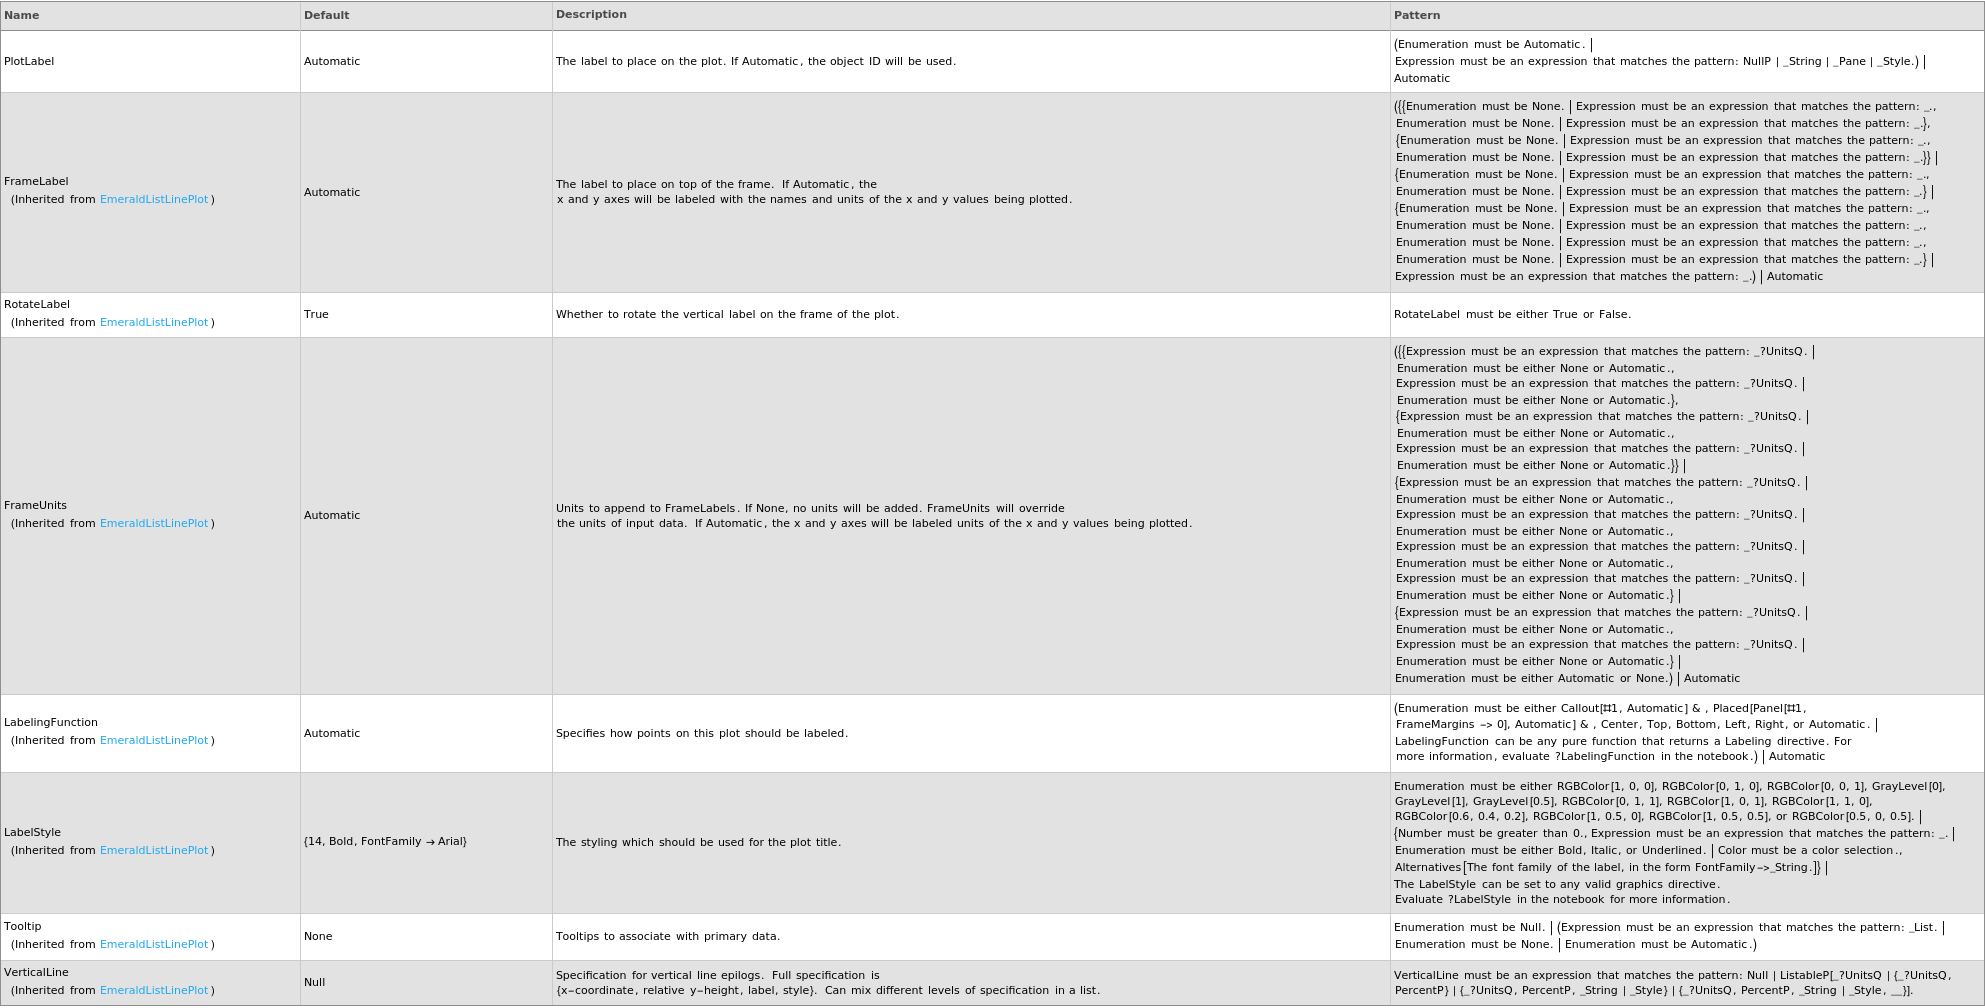
Plot Labeling Options
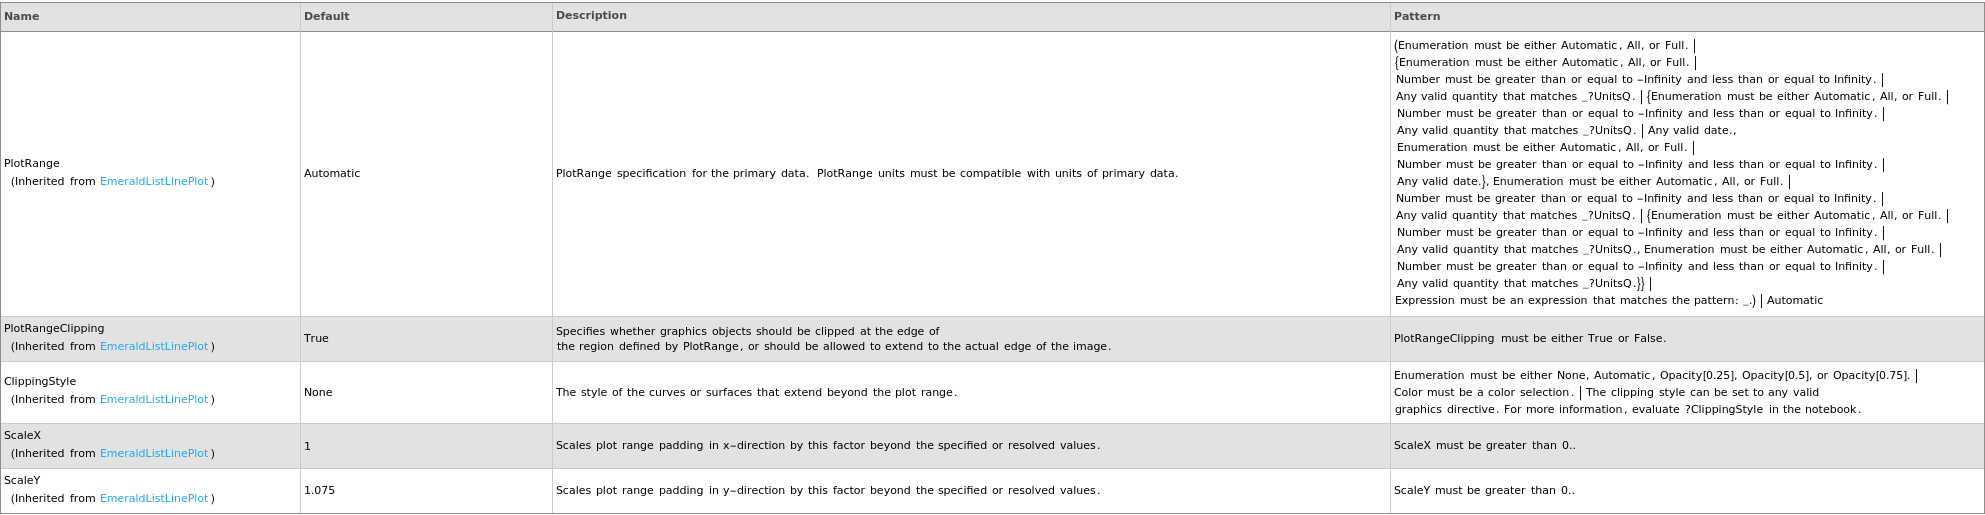
Plot Range Options
Plot Style Options
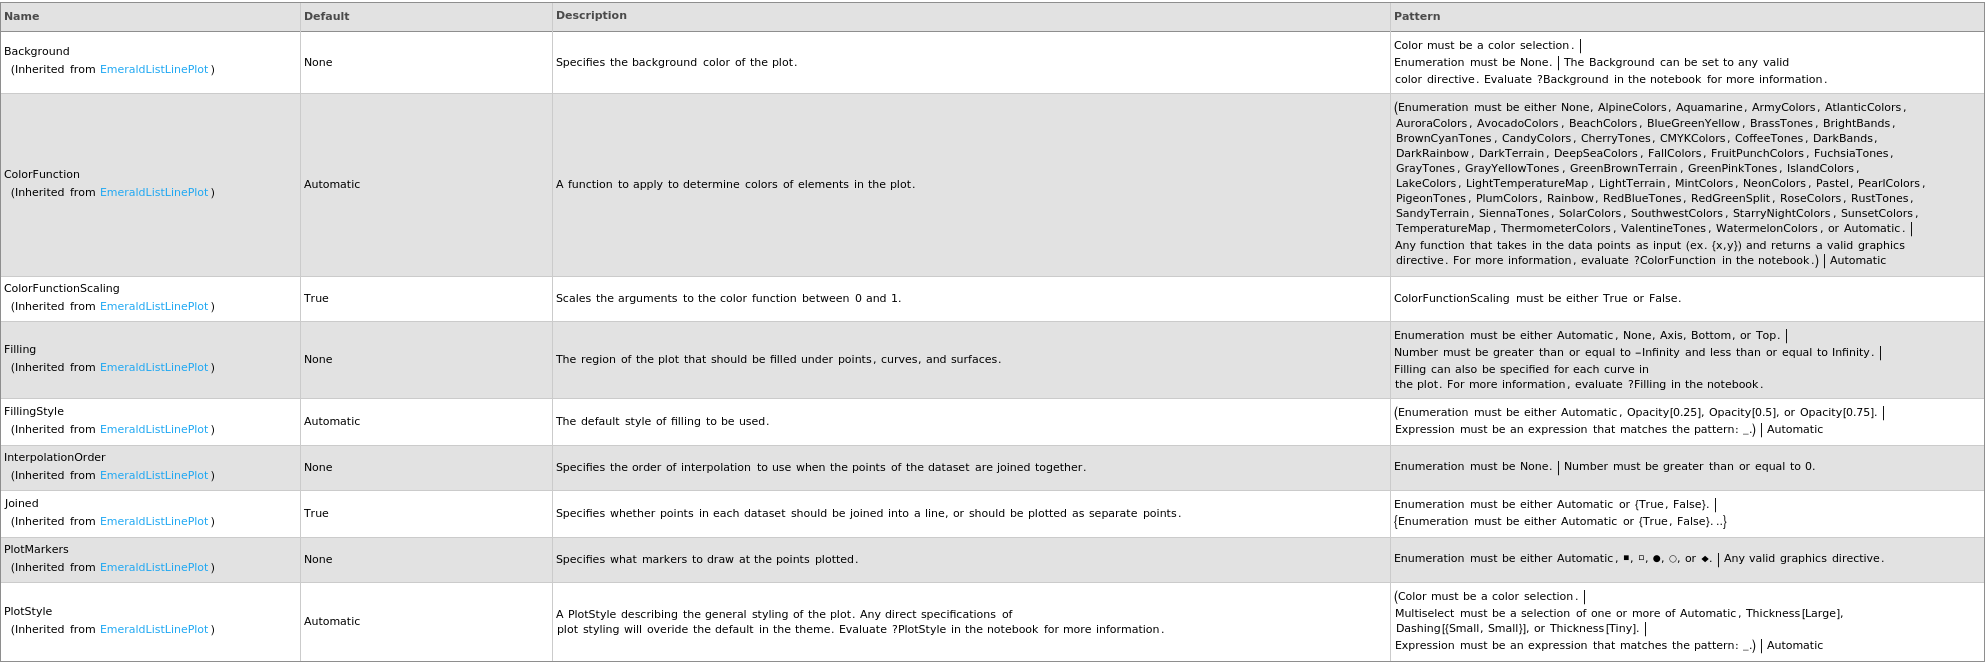
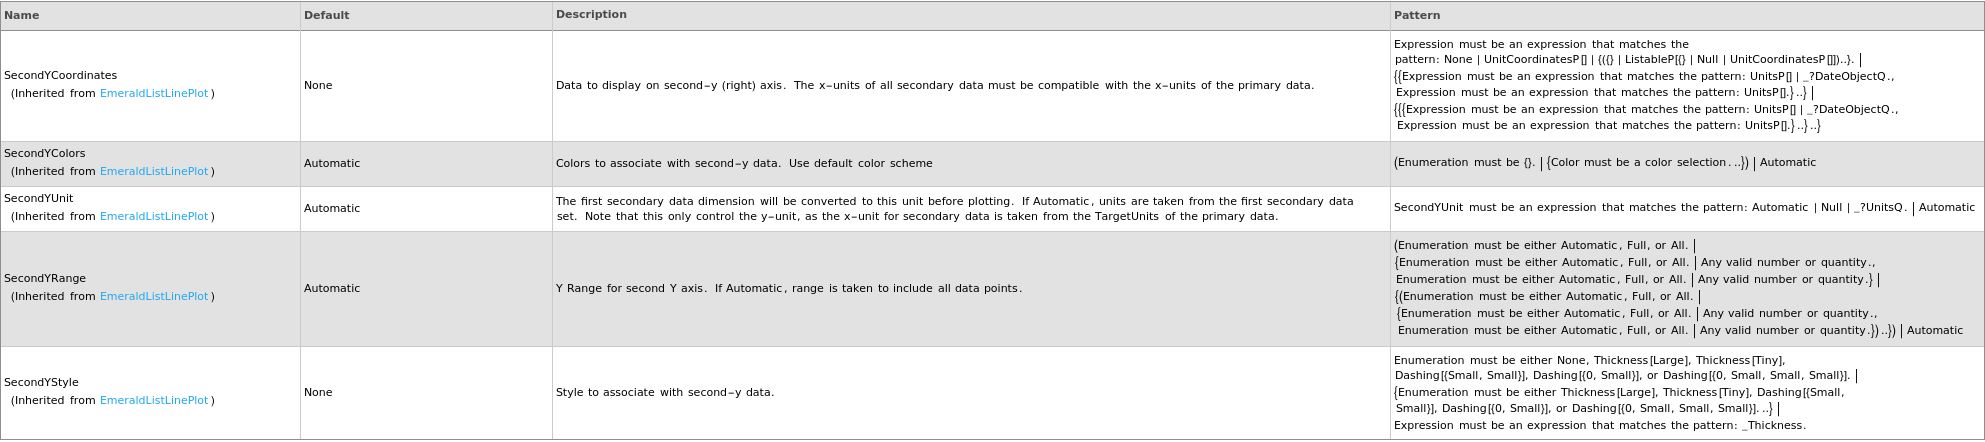
Secondary Data Options
General Options

Examples
open allclose allBasic Examples (6)
Plots capillary isoelectric focusing data when given a CapillaryIsoelectricFocusing protocol object:
Plots capillary isoelectric focusing data when given a list of XY coordinates representing the spectra:
Plots capillary isoelectric focusing data when given a list of XY coordinates representing the spectra:
Plots capillary isoelectric focusing data when given an CapillaryIsoelectricFocusing data link:
Plots capillary isoelectric focusing data when given an CapillaryIsoelectricFocusing data object:
