PlotELISA
PlotELISA[ElisaData]⟹Plot
displays the absorbance, fluorescence, or luminescence intensities (ELISA), fluorescence intensities (CapillaryELISA with customized cartridges) or analyte concentration (CapillaryELISA with pre-loaded cartridges) vs dilution factors for the supplied ElisaData.
PlotELISA[Protocol]⟹Plot
displays the absorbance, fluorescence, or luminescence intensities (ELISA), fluorescence intensities (CapillaryELISA with customized cartridges) or analyte concentration (CapillaryELISA with pre-loaded cartridges) vs dilution factors collected during Protocol.
Details
Input

Output

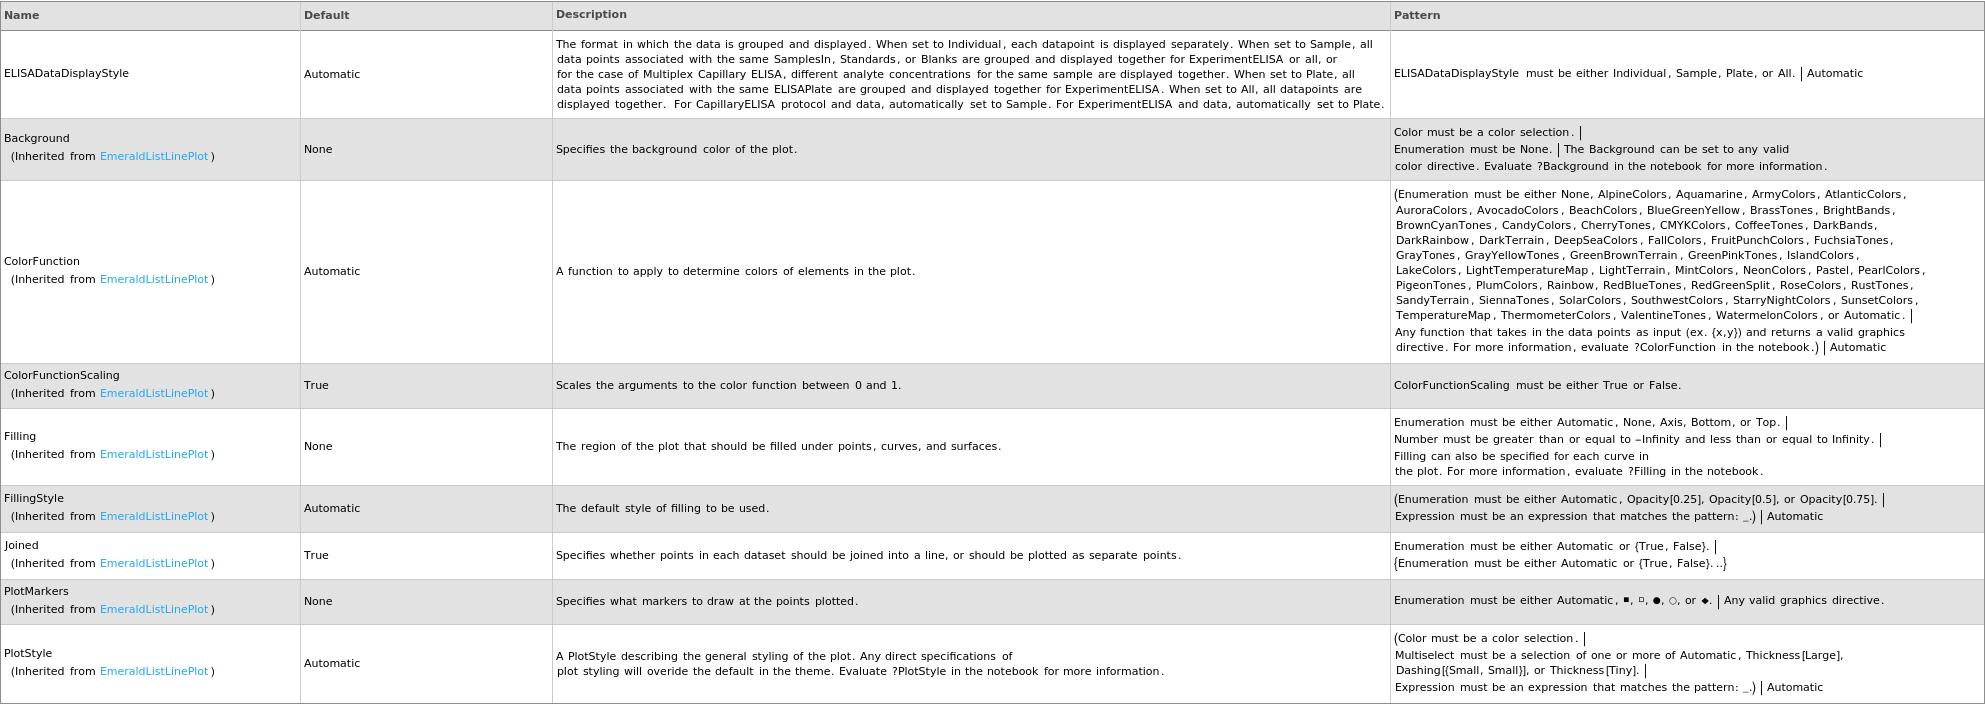
Data Specifications Options

Frame Options
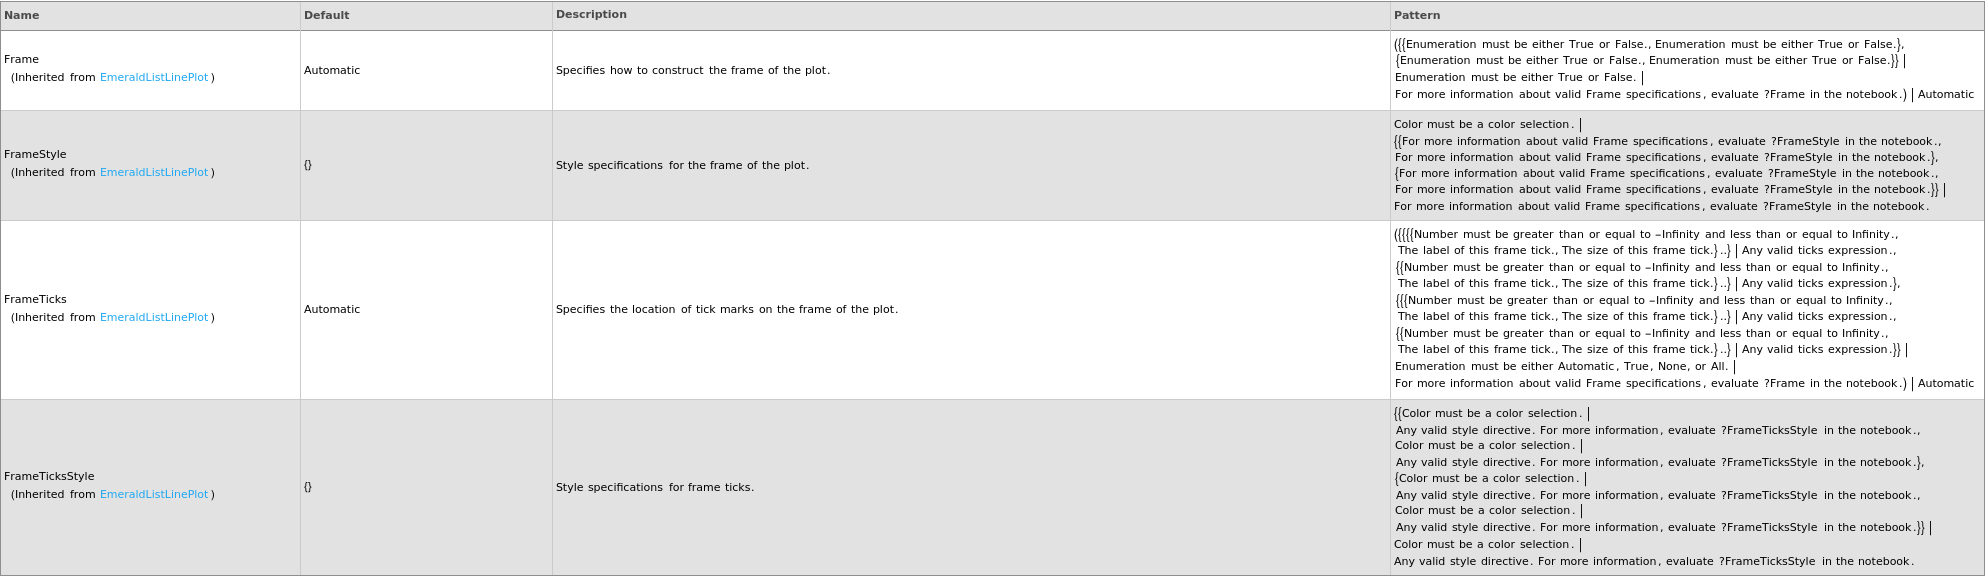
Grid Options
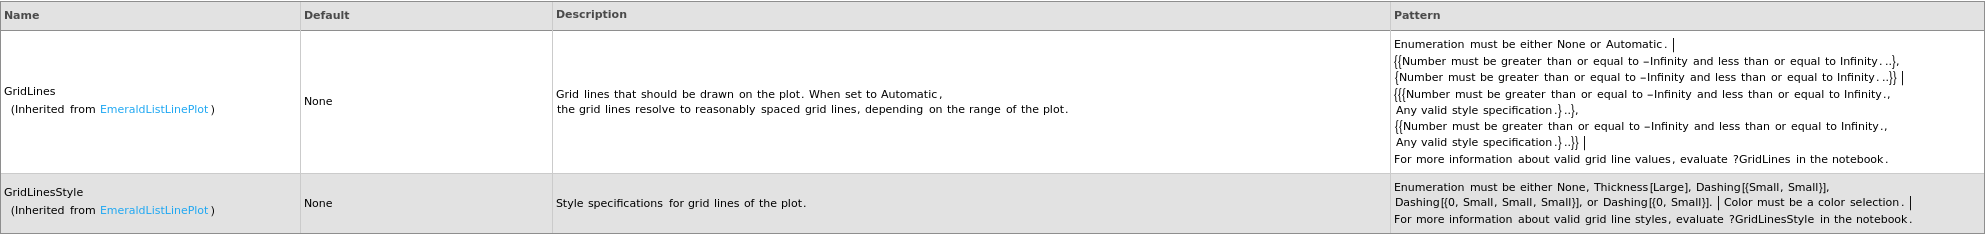
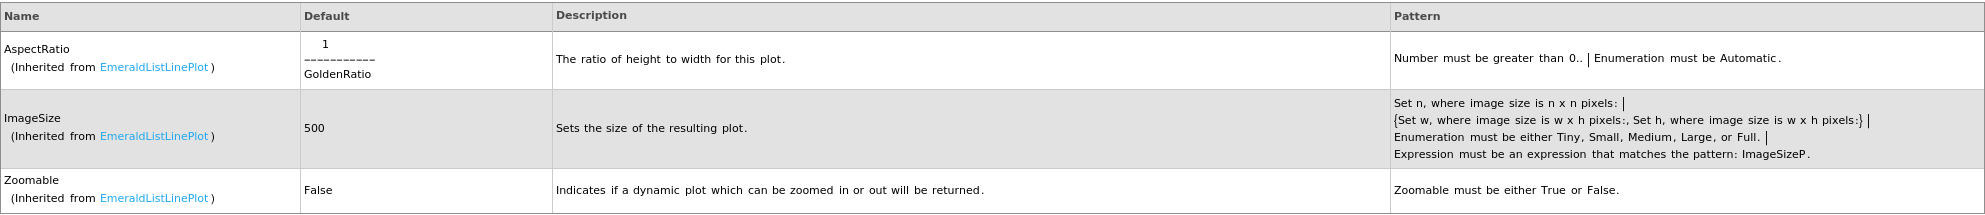
Image Format Options
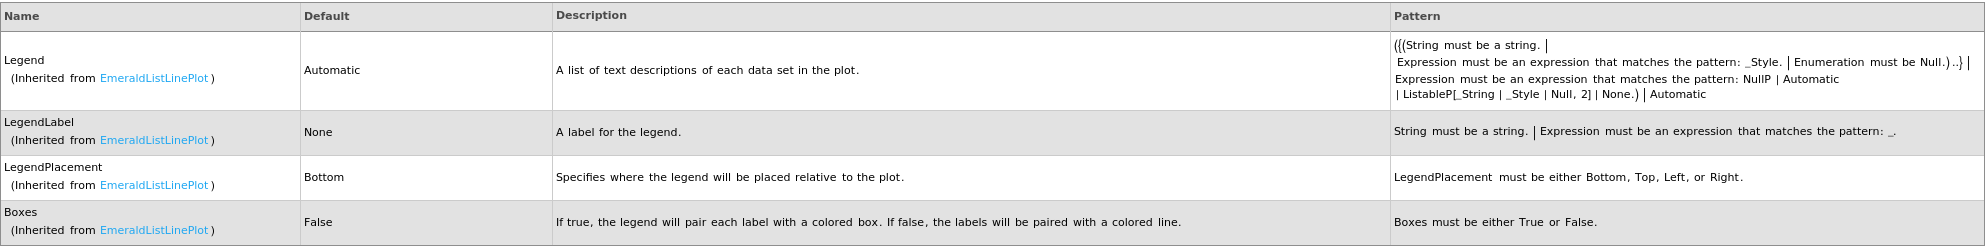
Legend Options
Plot Labeling Options
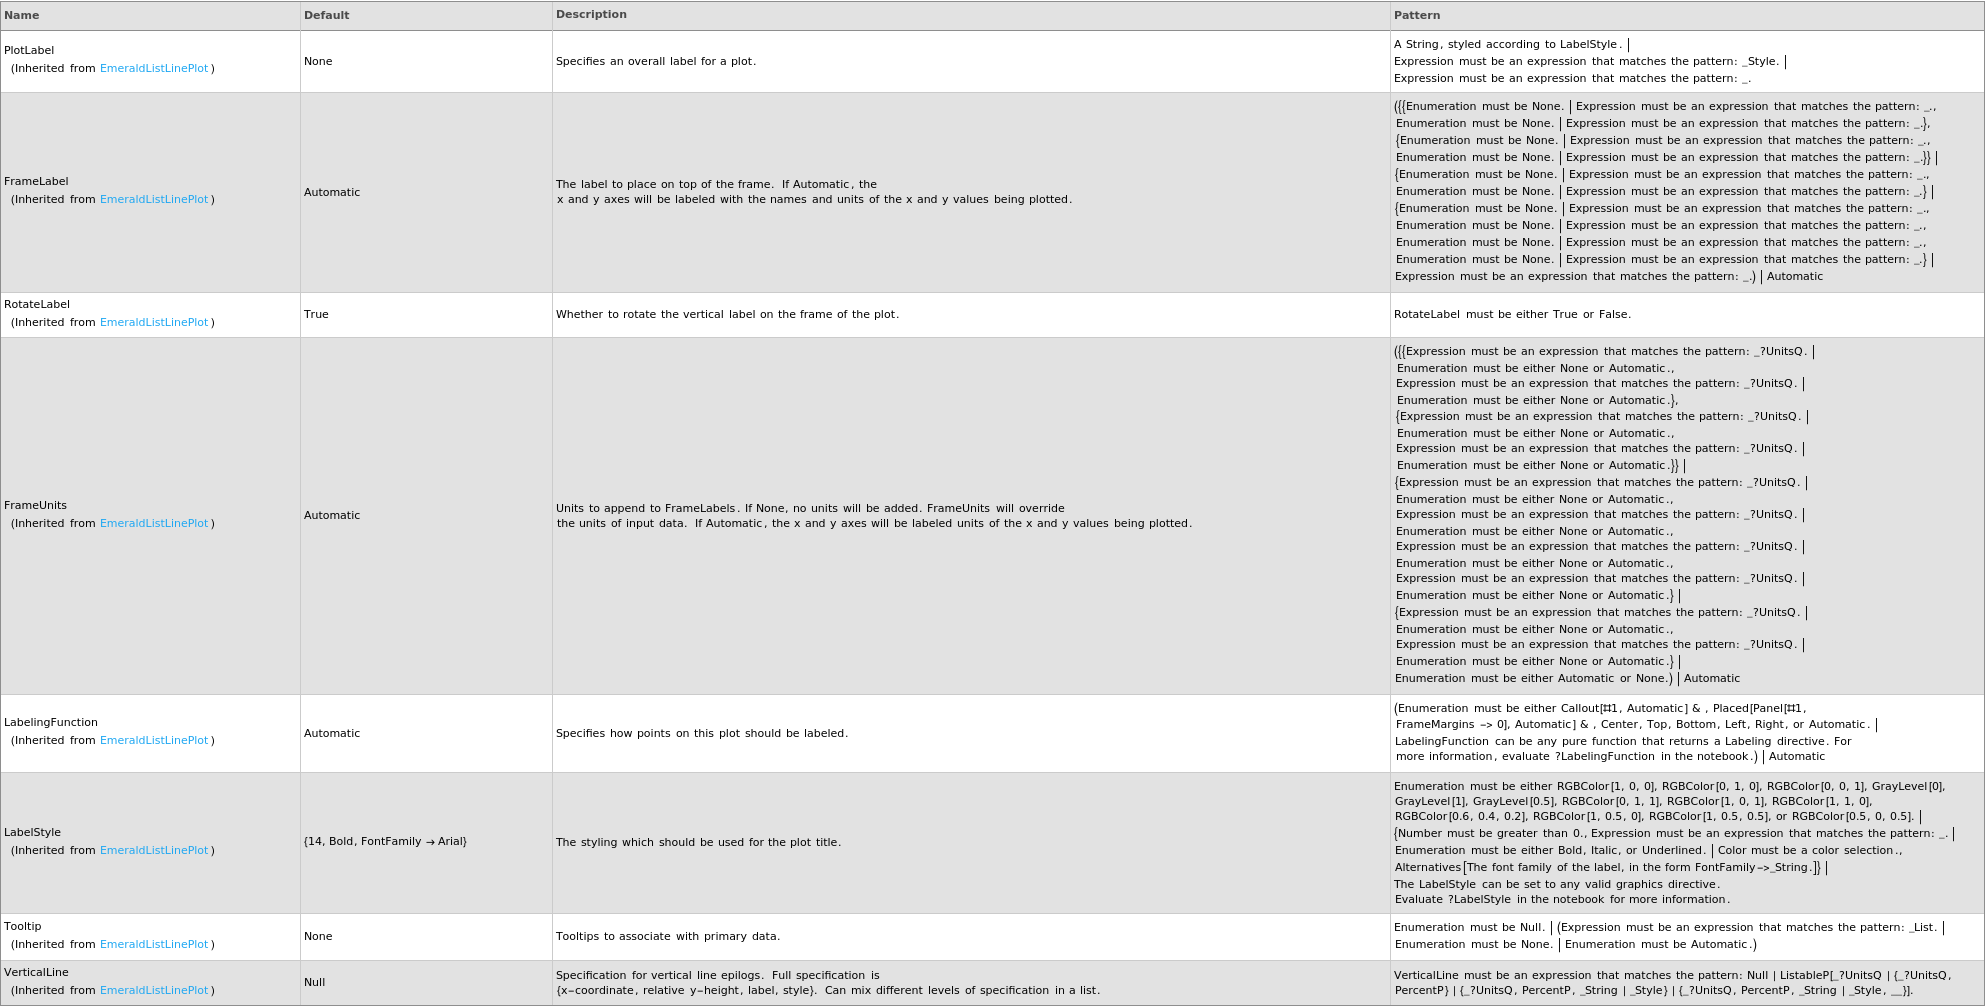
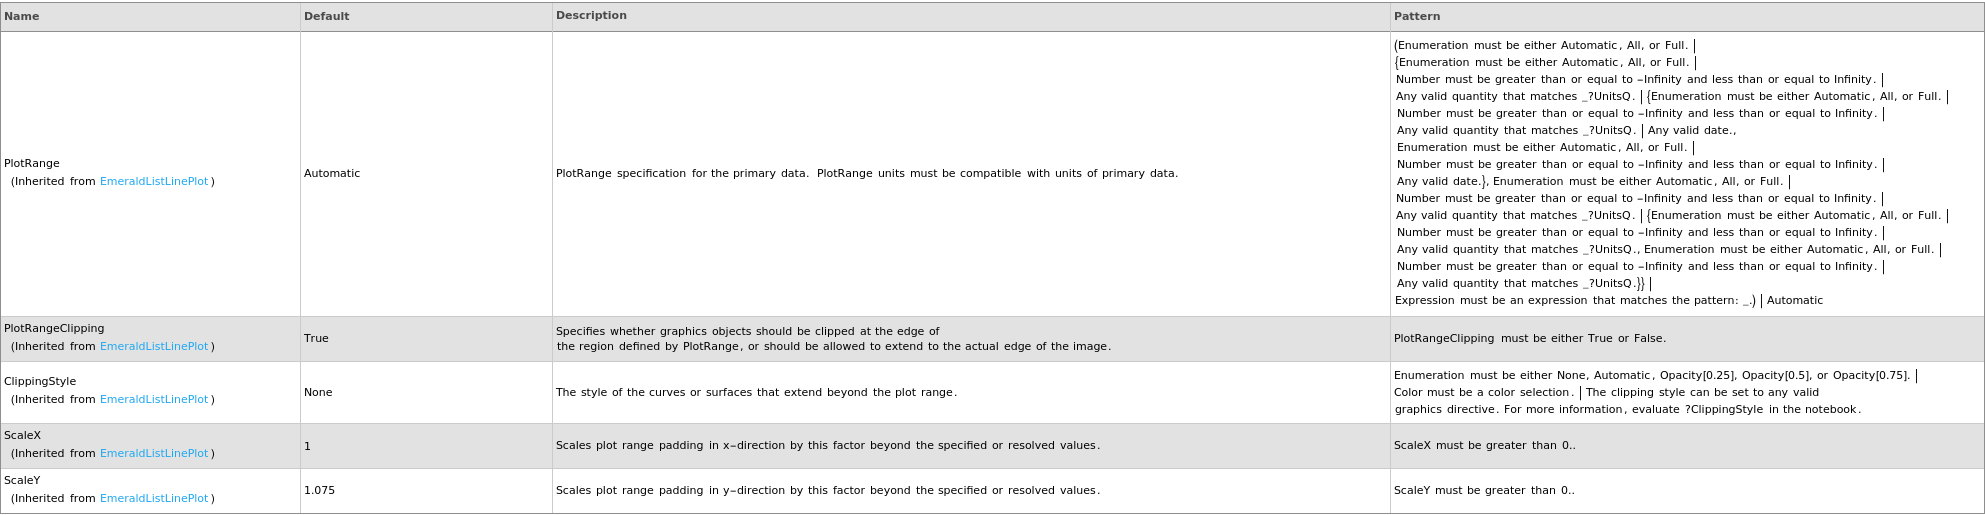
Plot Range Options
Plot Style Options
General Options

Examples
open allclose allBasic Examples (8)
Given an Object[Data,ELISA] from ExperimentCapillaryELISA with a customizable cartridge, PlotELISA returns a plot:
Given an Object[Data,ELISA] from ExperimentCapillaryELISA with a pre-loaded cartridge, PlotELISA returns a plot:
Given an Object[Data,ELISA] from ExperimentCapillaryELISA with Multiplex, PlotELISA returns a plot:
Given an Object[Protocol,CapillaryELISA], PlotELISA returns a plot:
Given an Object[Protocol,ELISA] with DetectionMode set to AbsorbanceIntensity, PlotELISA returns a plot:
Given an Object[Protocol,ELISA] with DetectionMode set to FluorescenceIntensity, PlotELISA returns a plot:
Given an Object[Protocol,ELISA] with DetectionMode set to LuminescenceIntensity, PlotELISA returns a plot:
Given multiple Object[Data,ELISA], PlotELISA returns a plot:
Options (13)
ELISADataDisplayStyle (5)
ELISADataDisplayStyle is default to Sample for CapillaryELISA:
When ELISADataDisplayStyle is specified to All, all data are plotted together:
When ELISADataDisplayStyle is specified to Individual, each analyte is displayed separately for Multiplex CapillaryELISA:
When ELISADataDisplayStyle is specified to Plate, all data from the same ELISAPlate are plotted together with separate legends for wavelengths:
When ELISADataDisplayStyle is specified to Sample, all data with the same SamplesIn are plotted together with separate legends for spiking and wavelengths:


