PlotFluorescenceIntensity
PlotFluorescenceIntensity[FluorescenceData]⟹Plot
provides a graphical plot of the provided fluorescence intensities from the given data objects either in the form of a histogram or a box and whisker plot.
PlotFluorescenceIntensity[Protocol]⟹Plot
creates a Plot of fluorescence intensities in the data objects found in the Data field of Protocol.
PlotFluorescenceIntensity[Intensities]⟹Plot
provides a graphical plot of the provided fluorescence intensities either in the form of a histogram or a box and whisker plot.
Details
Input

Output

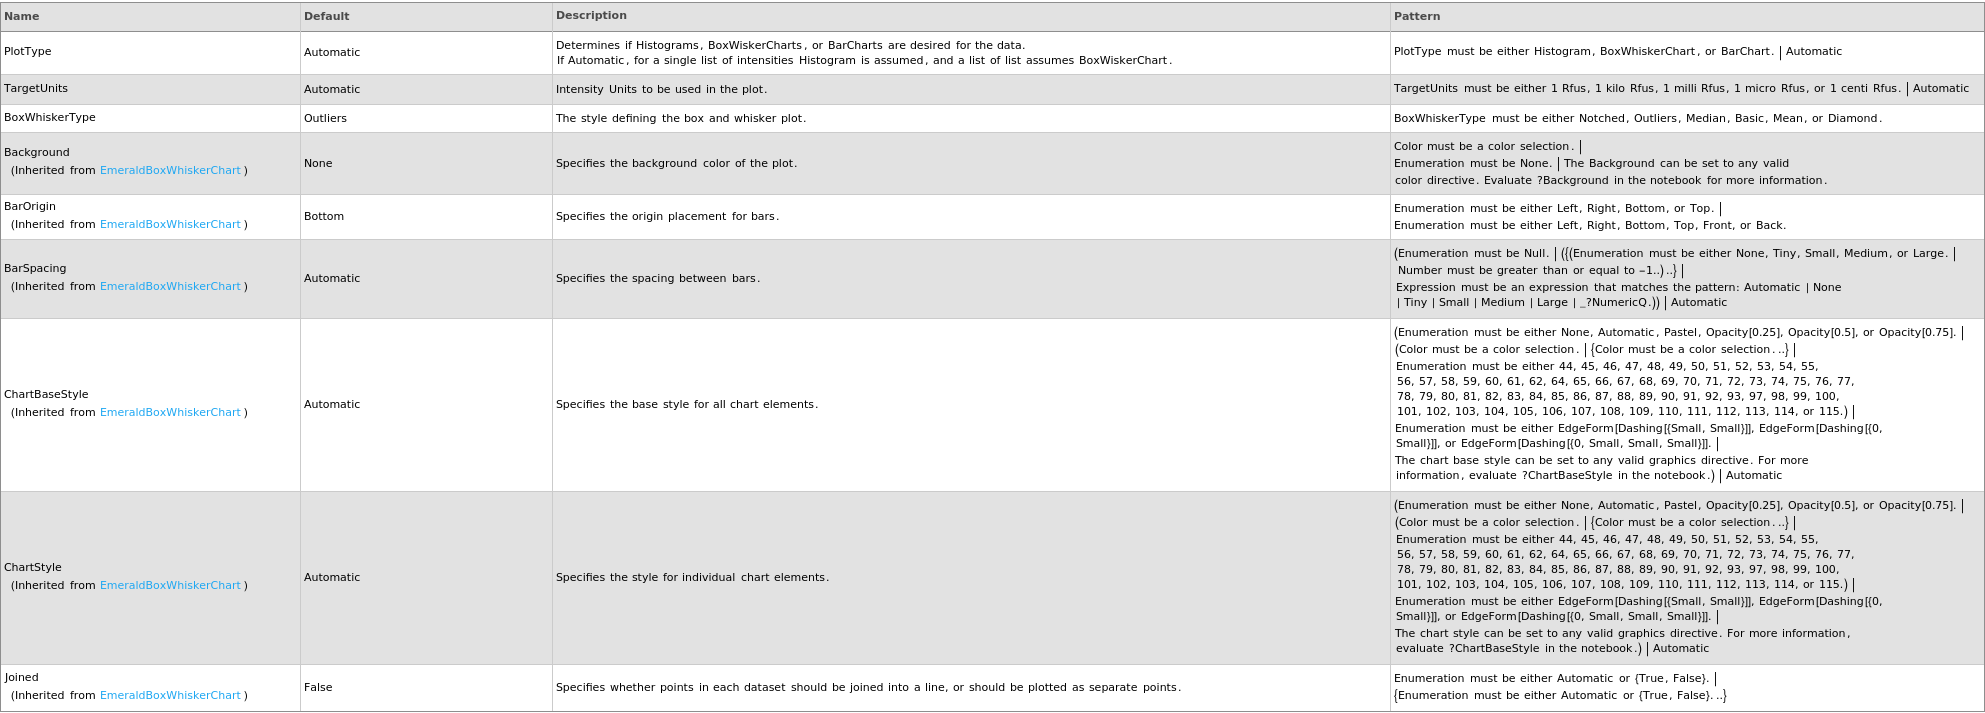
Data Processing Options

Data Specifications Options

Frame Options
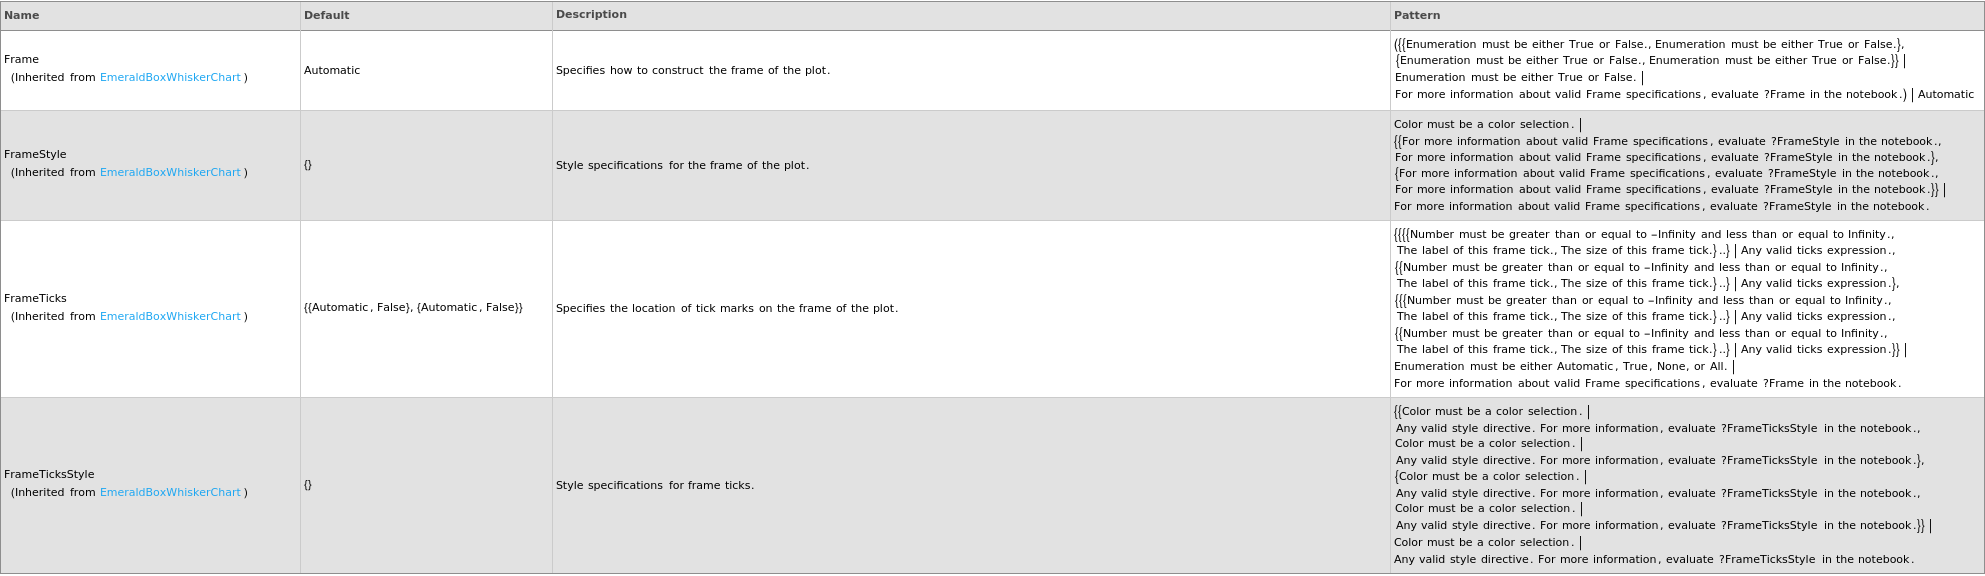
Grid Options
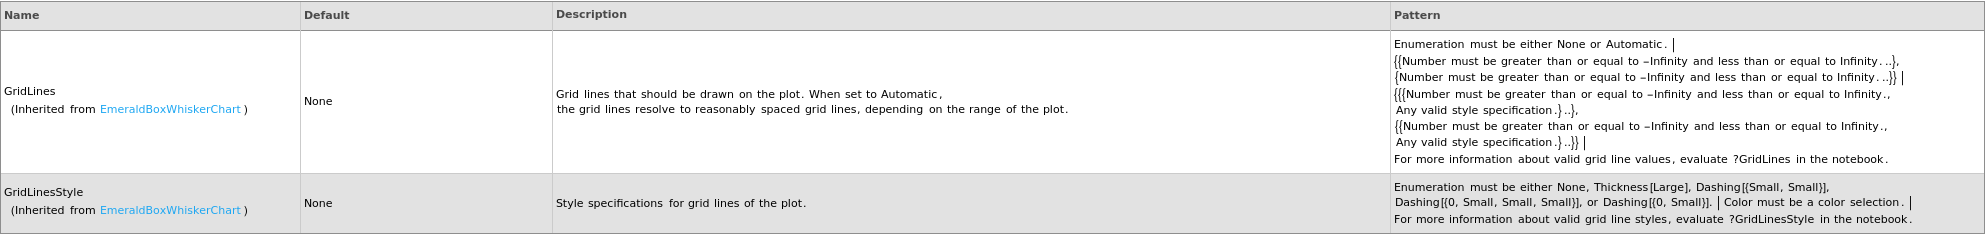
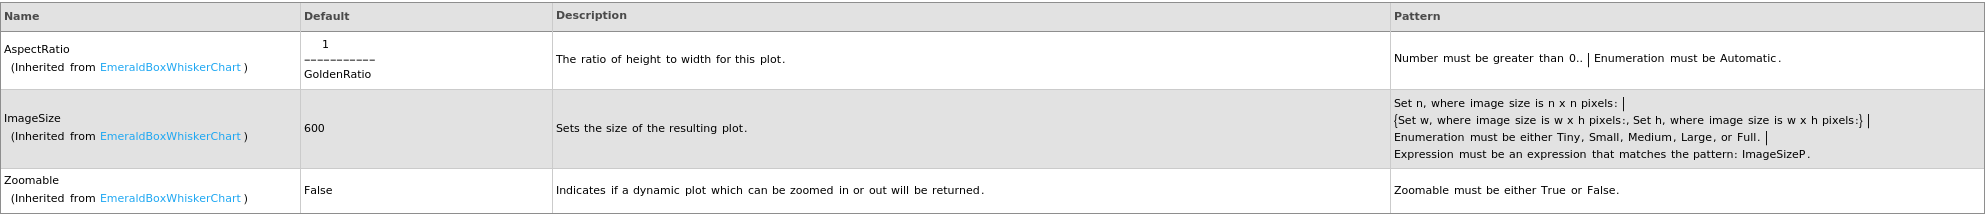
Image Format Options
Legend Options

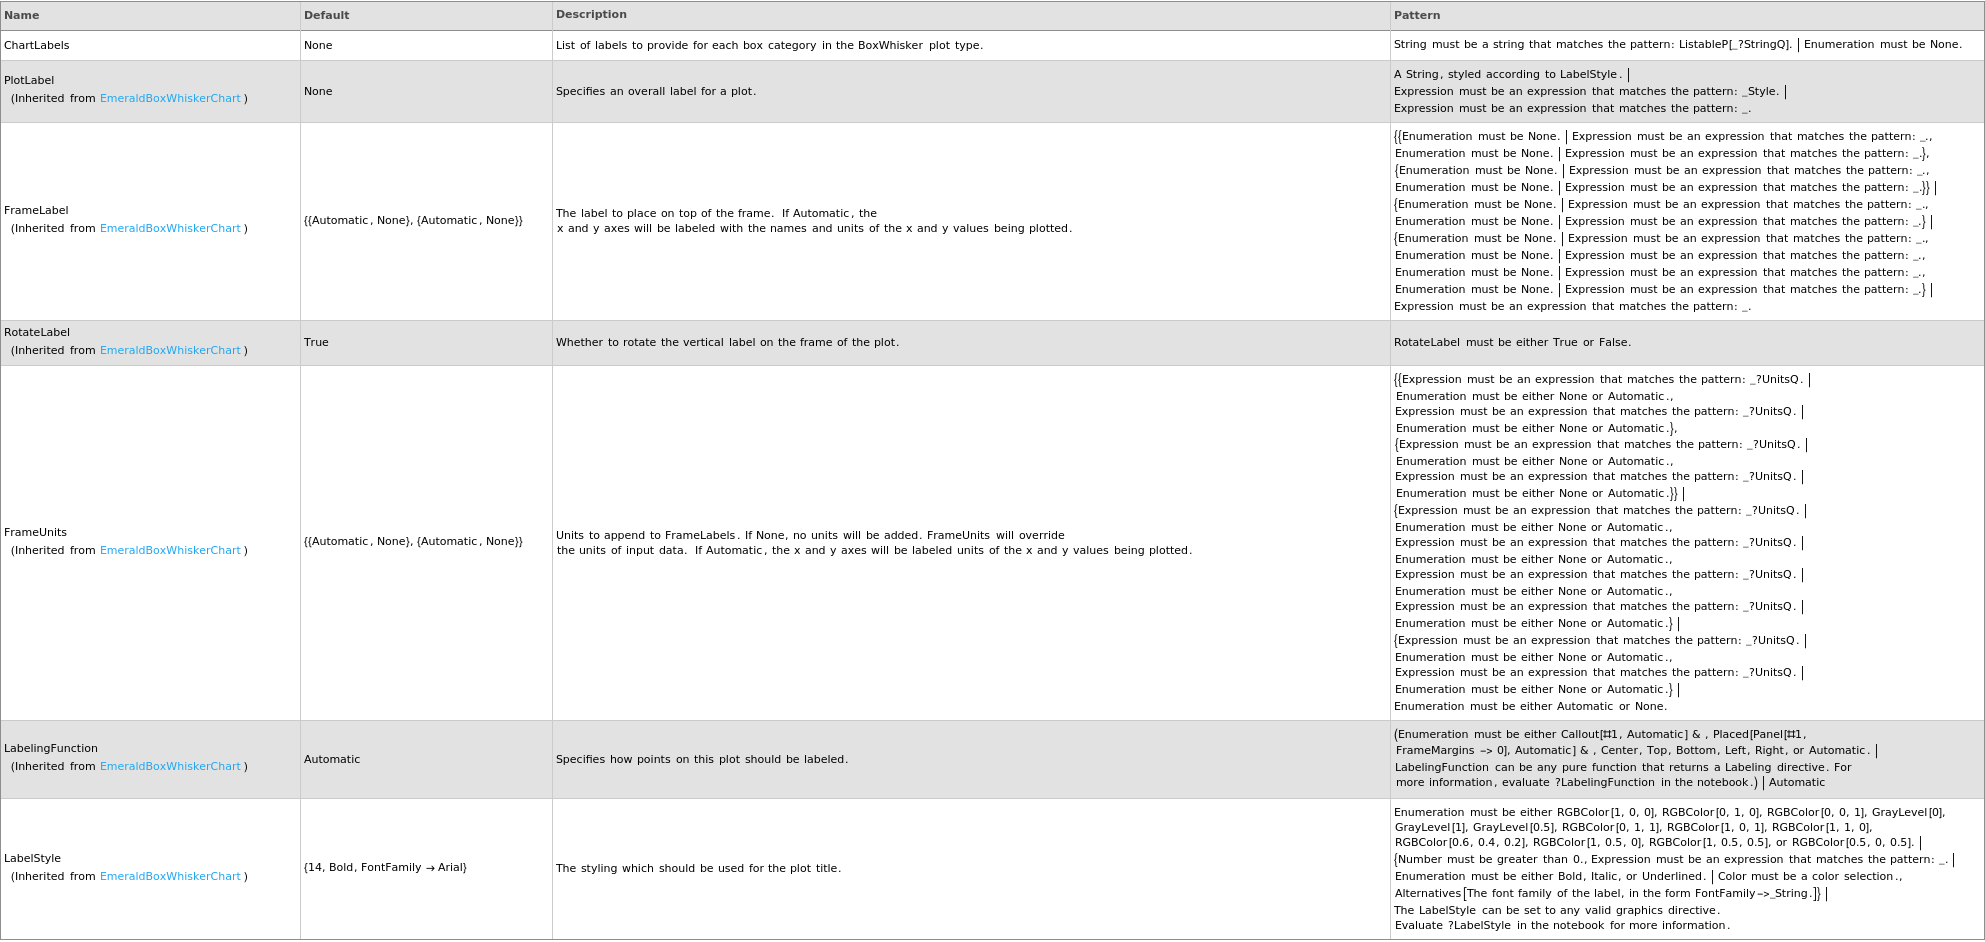
Plot Labeling Options
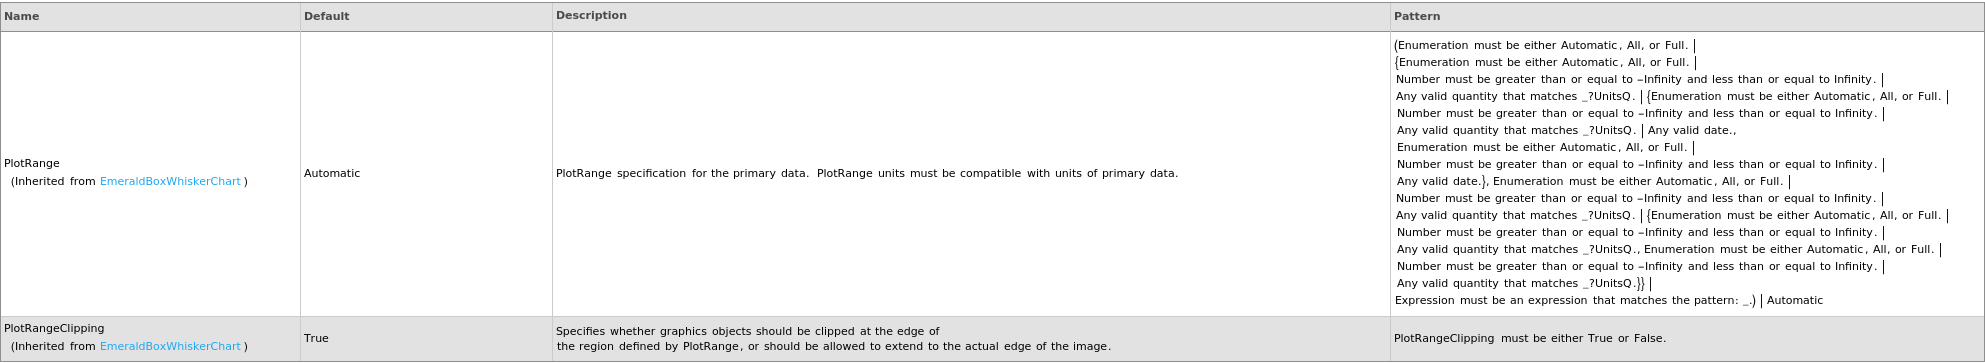
Plot Range Options
Plot Style Options
General Options

Examples
open allclose allBasic Examples (5)
Additional Examples (6)
Options (19)
BoxWhiskerType (1)
DataSet (2)
Output (3)
PlotType (4)
Messages (3)
DuplicateWavelengths (1)

MismatchedWavelengthsAndIntensities (1)


Last modified on Fri 19 Sep 2025 08:46:16