PlotPrediction
PlotPrediction[FitObject,InputValue]⟹Fig
this function plots the result of the fitting analysis along with predicted value and distributions.
PlotPrediction[FitObject,X]⟹Fig
this function plots the result of the fitting analysis along with predicted value and distributions.
Details
Input

Output

Data Specifications Options
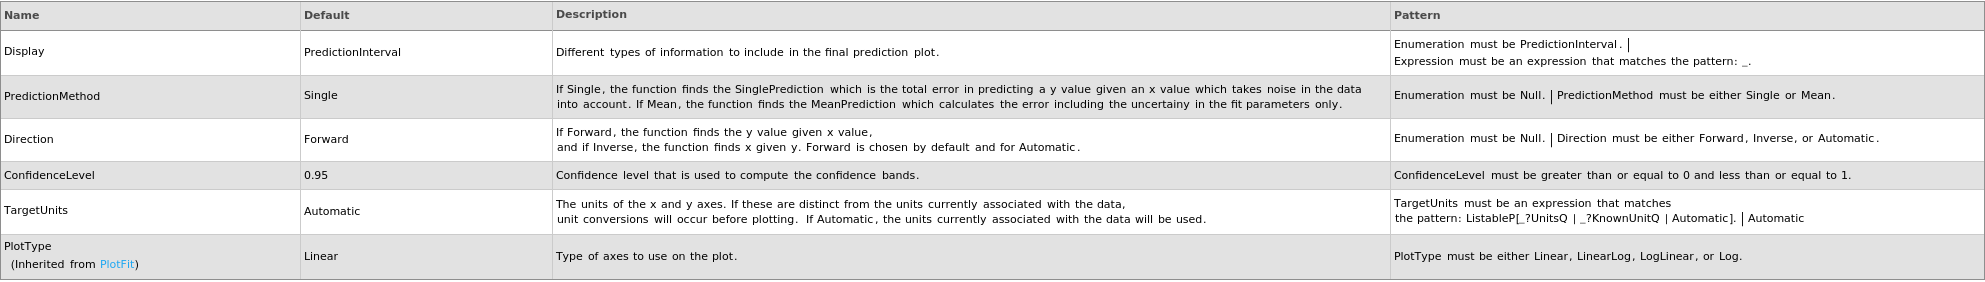
Error Bands Options

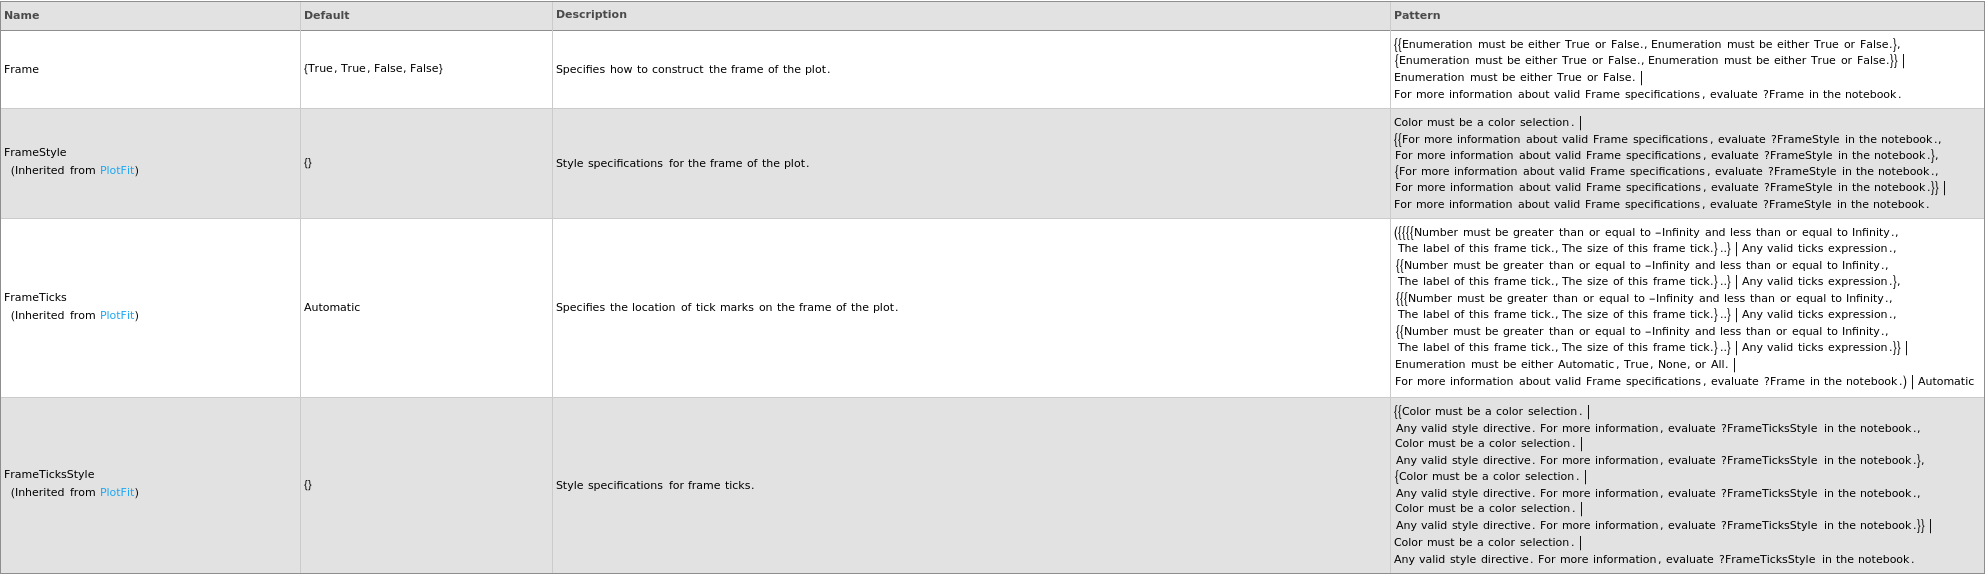
Frame Options
Grid Options
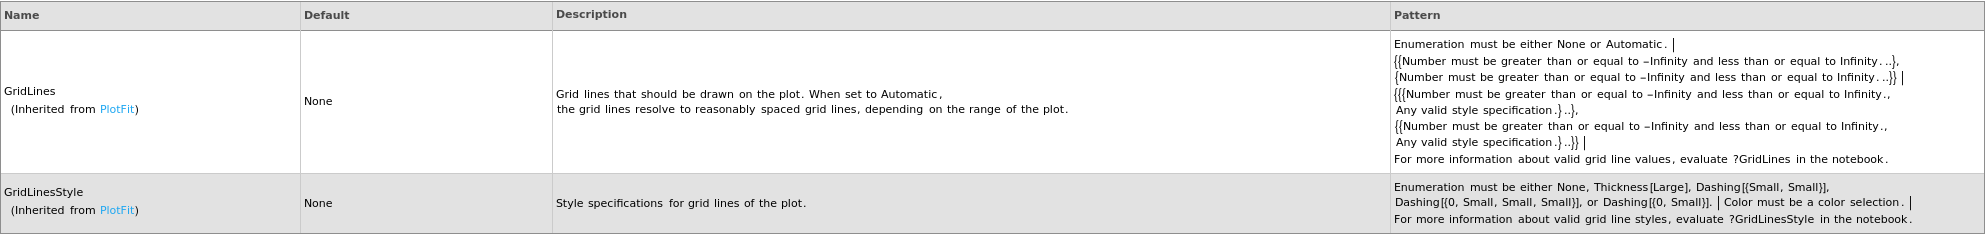
Image Format Options

Legend Options

Outliers Options

Plot Fit Options

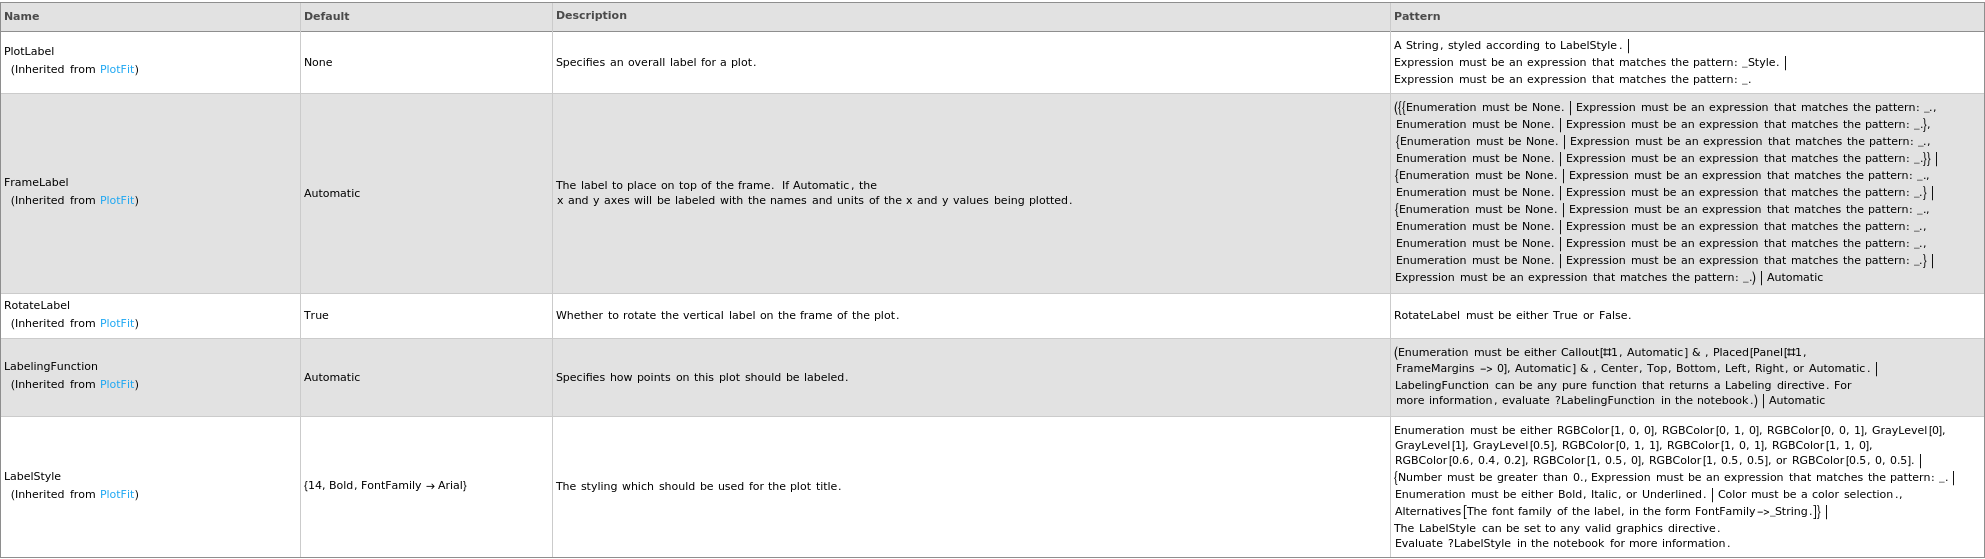
Plot Labeling Options
Plot Range Options
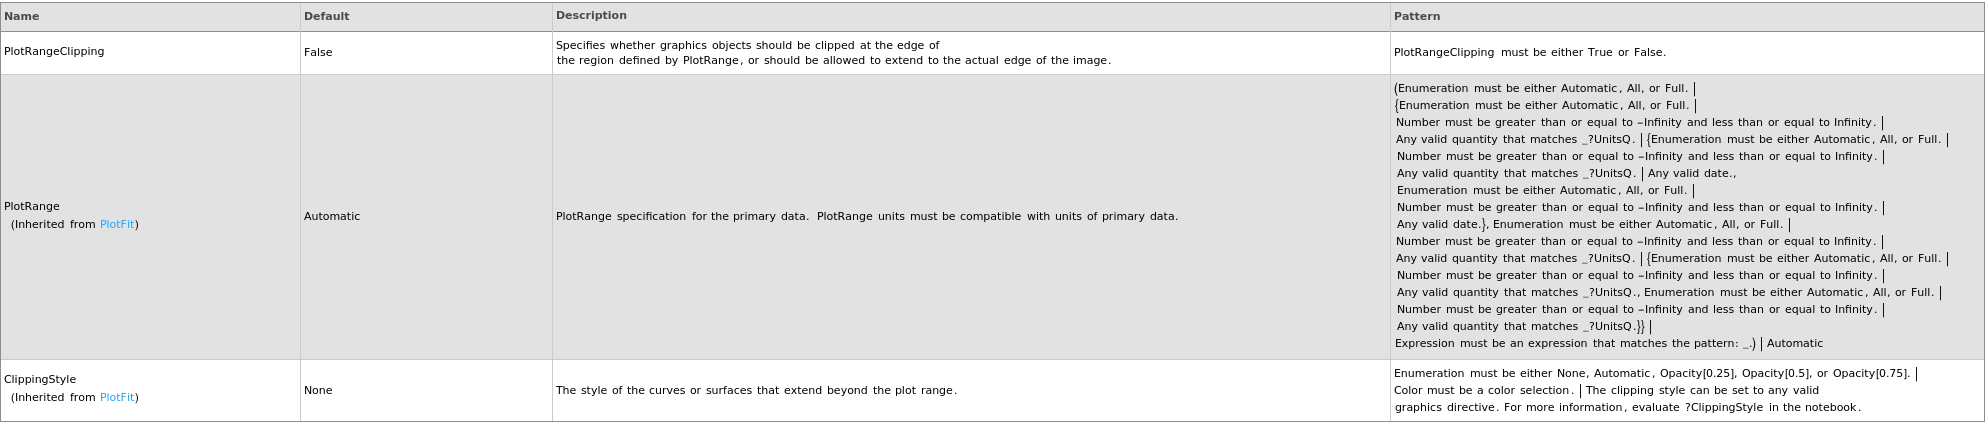
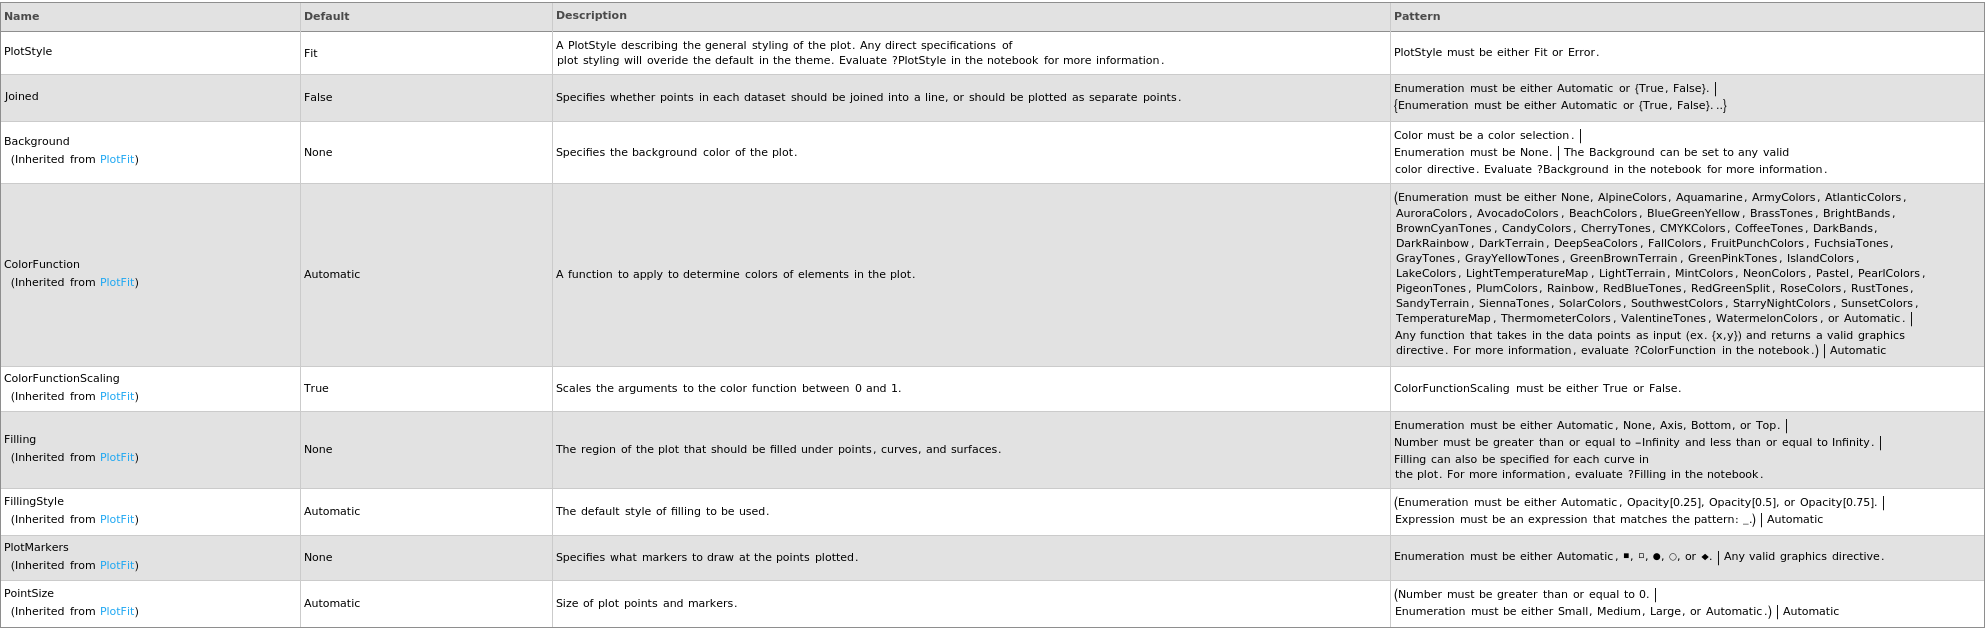
Plot Style Options
General Options

Examples
open allclose allBasic Examples (2)
Options (13)
Direction (1)
Joined (1)
PlotRangeClipping (1)
Last modified on Wed 20 Aug 2025 23:26:00