PlotSanMateoCOVIDCases
PlotSanMateoCOVIDCases[]⟹plot
generates a plot of new COVID-19 cases in San Mateo county for the last 30 days. Data is taken from the New York Times' public data repository.
PlotSanMateoCOVIDCases[timeAgo]⟹plot
generates a plot of new COVID-19 cases from timeAgo until now.
PlotSanMateoCOVIDCases[startTime,endTime]⟹plot
generates a plot of new COVID-19 cases in San Mateo county from startTime to endTime.
Details
-
OutOfRange Please note that the data set used `1` on `2` so your entire window cannot be shown. All available data within the window is presented.
Input

Output

Data Specifications Options
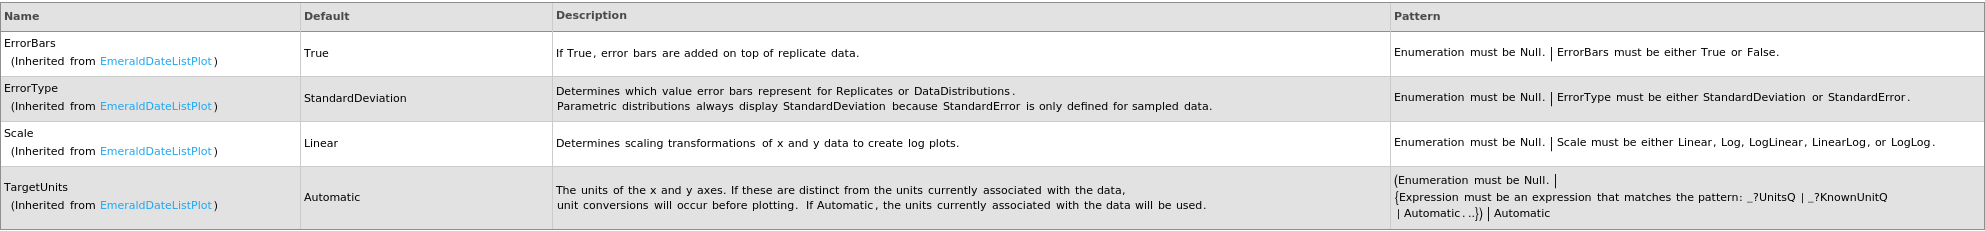
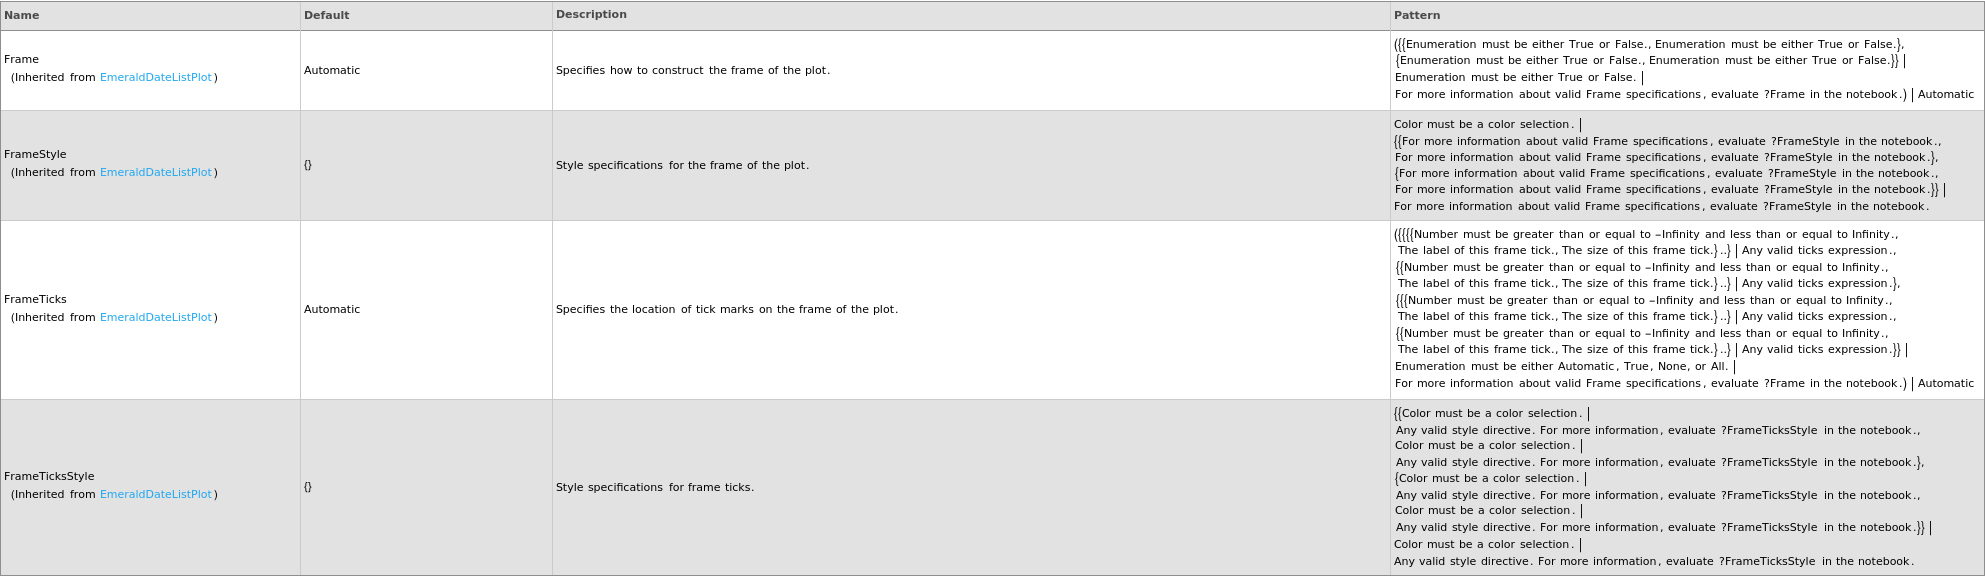
Frame Options
Grid Options
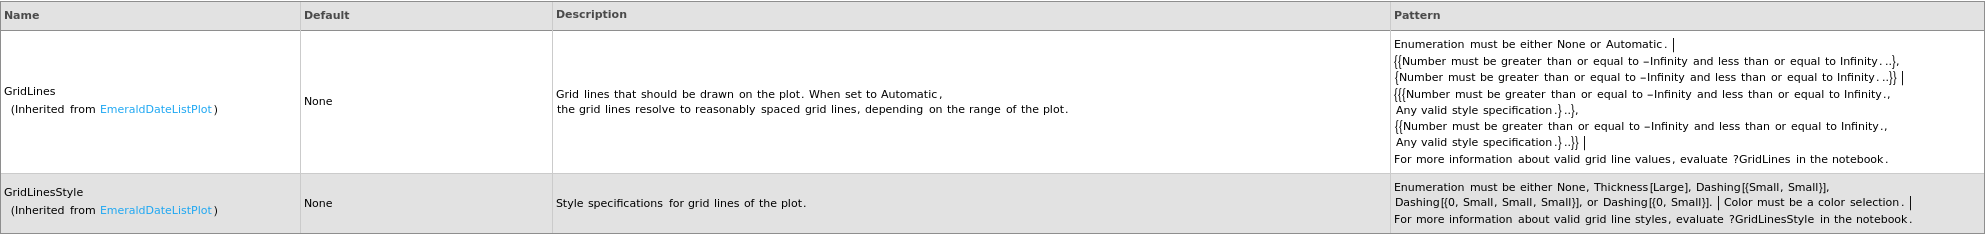
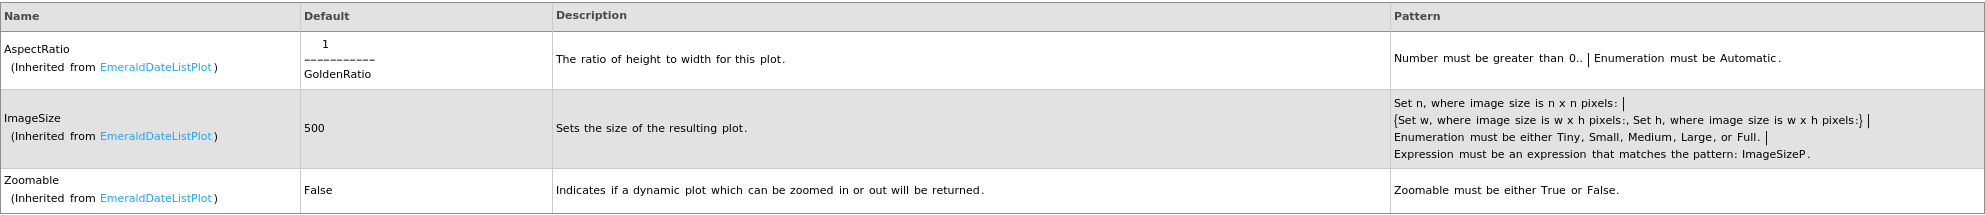
Image Format Options
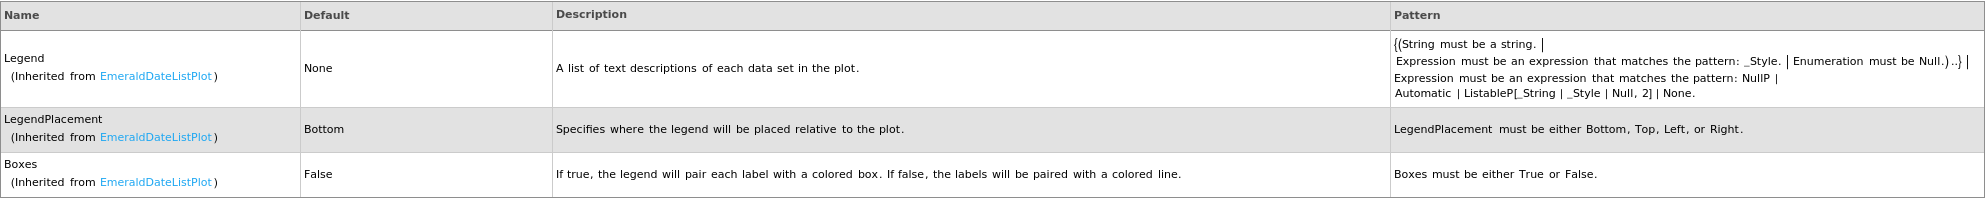
Legend Options
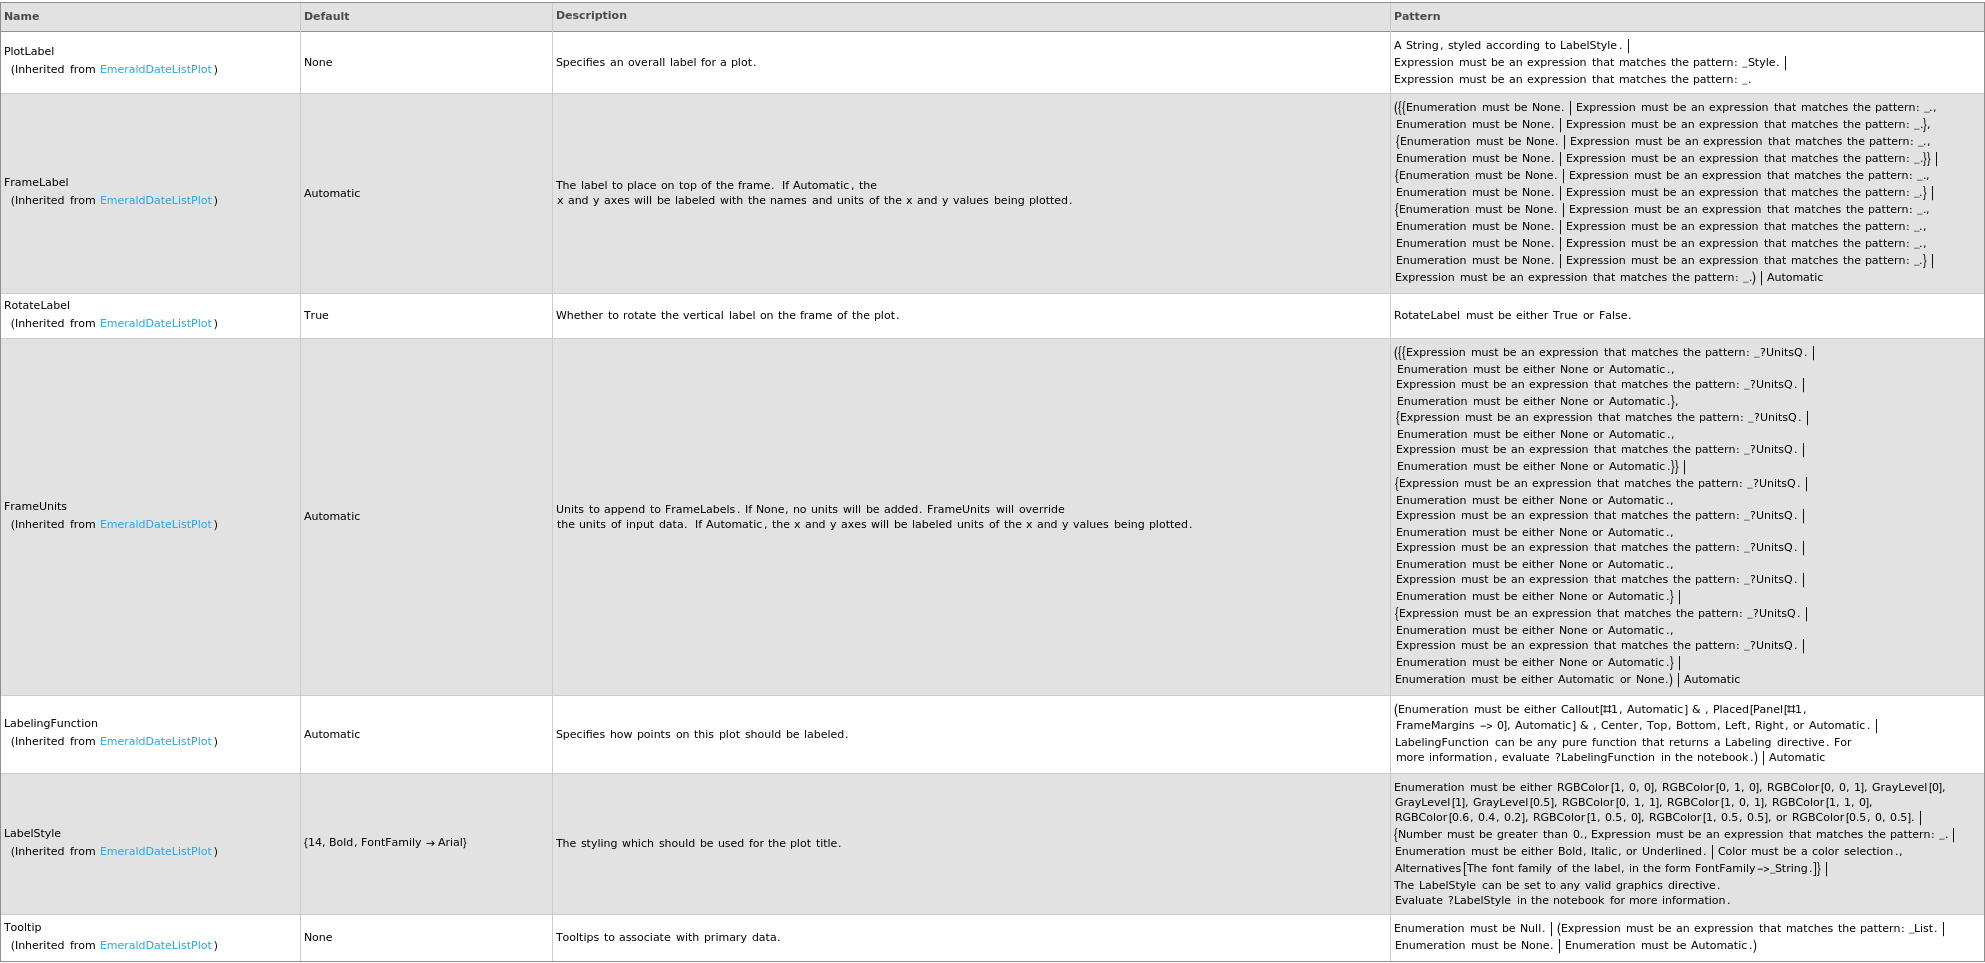
Plot Labeling Options
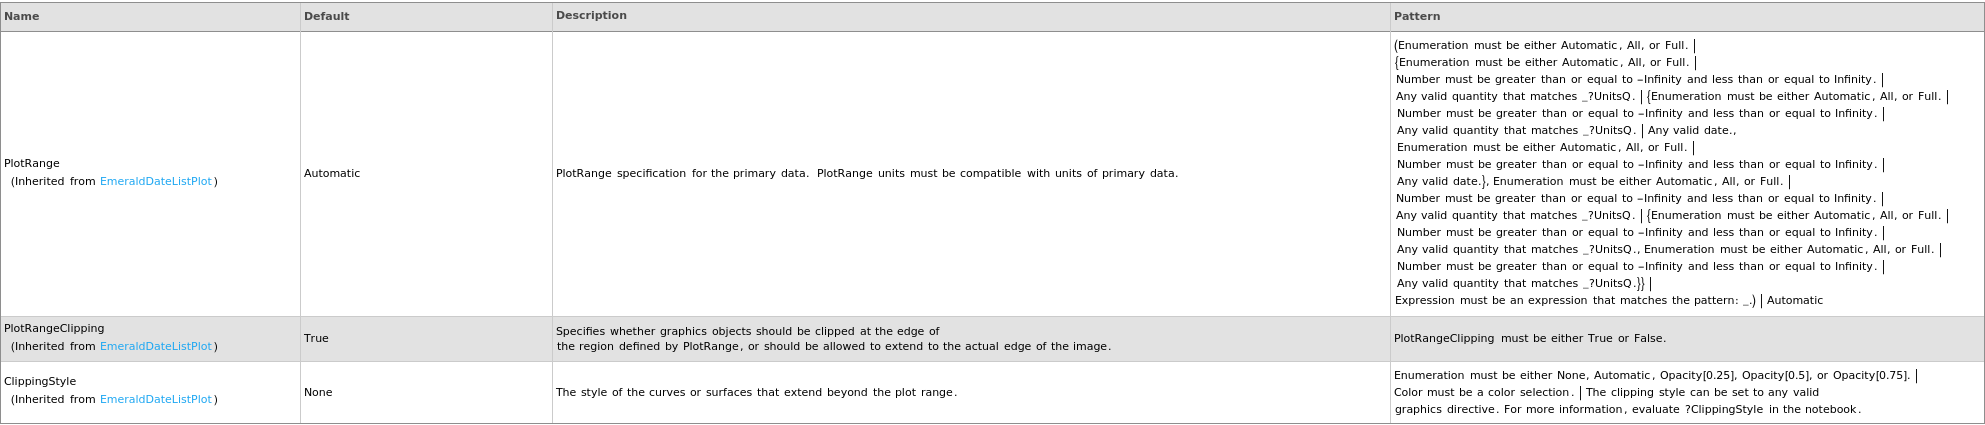
Plot Range Options
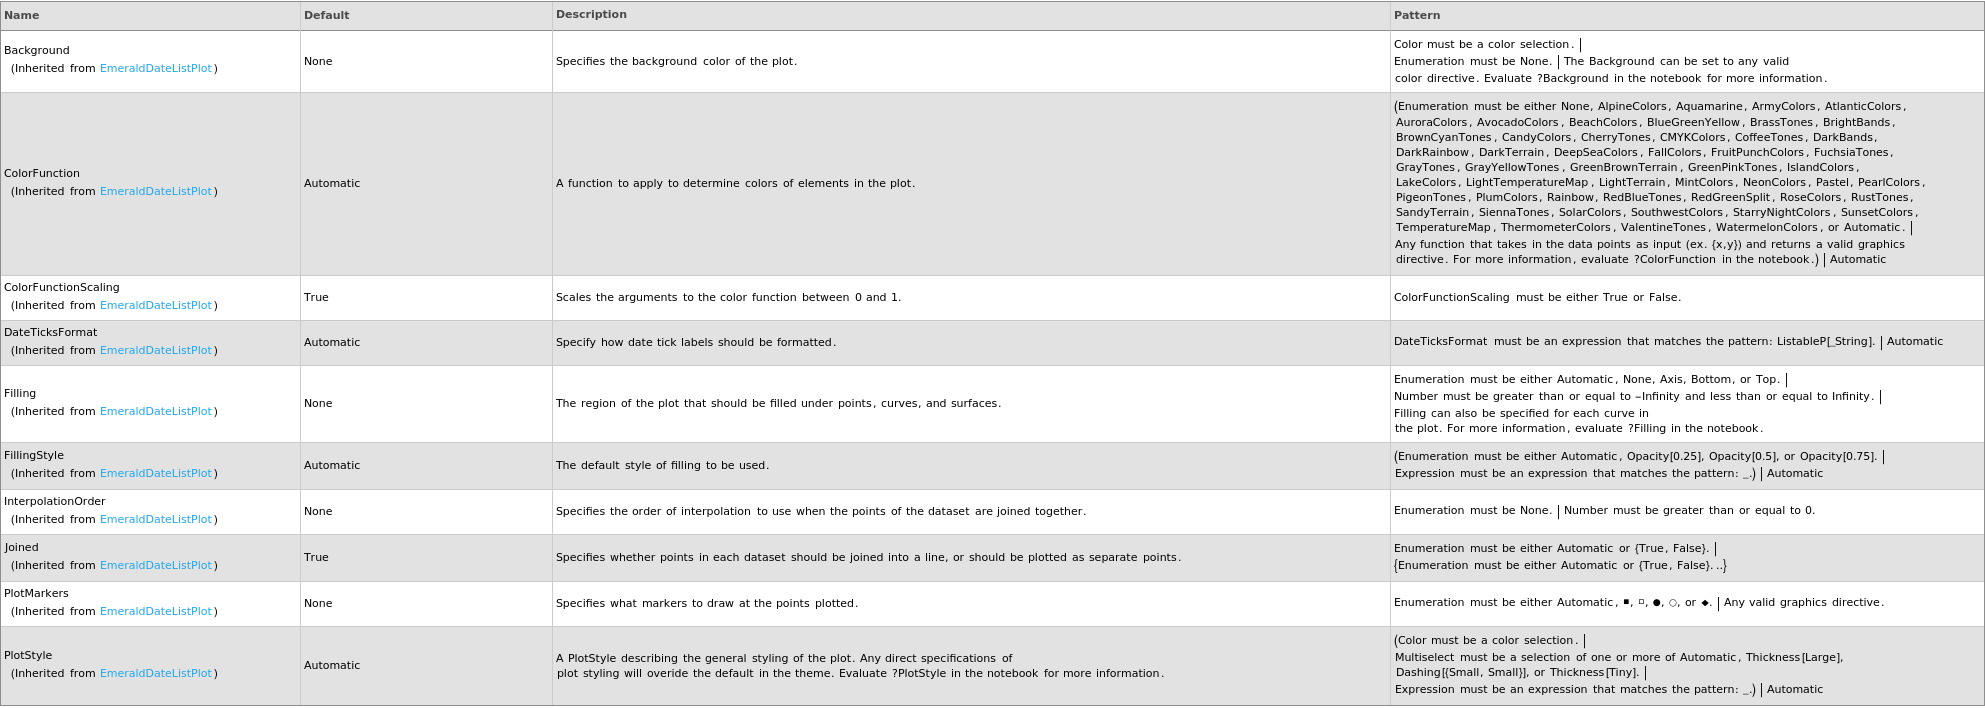
Plot Style Options
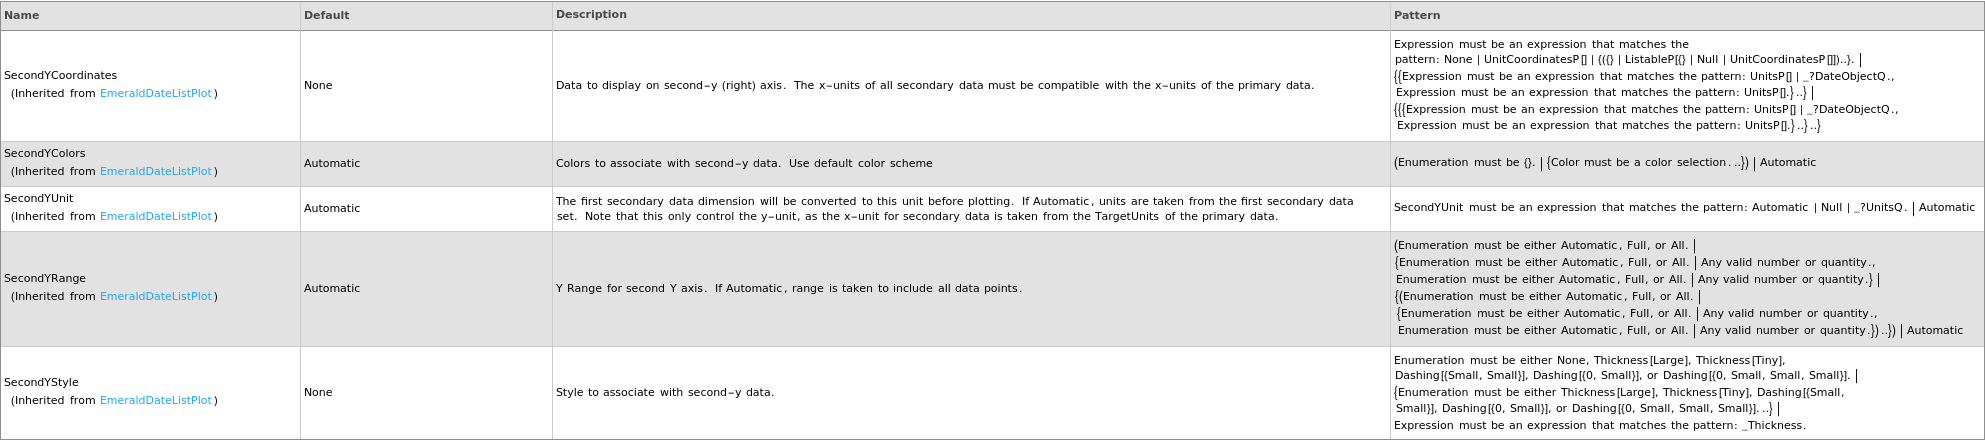
Secondary Data Options
General Options

Messages
Examples
open allclose allBasic Examples (4)
Options (3)

Last modified on Tue 7 Oct 2025 18:40:37