PlotAbsorbanceThermodynamics
PlotAbsorbanceThermodynamics[AbsorbanceThermodynamicsObject]⟹Plot
provides a graphical plot of the melting and/or cooling curves stored in the data object.
PlotAbsorbanceThermodynamics[Protocol]⟹Plot
creates a Plot of the melting and/or cooling curves stored in the data objects found in the Data field of Protocol.
PlotAbsorbanceThermodynamics[MeltingCurveData]⟹Plot
provides a graphical plot of the melting curve.
PlotAbsorbanceThermodynamics[MeltingCurveData,CoolingCurveData]⟹Plot
provides a graphical plot of the melting and cooling curve.
Details
- In order to join lists of melting and cooling curves, the lists must be the same length.
Input

Output

Data Specifications Options
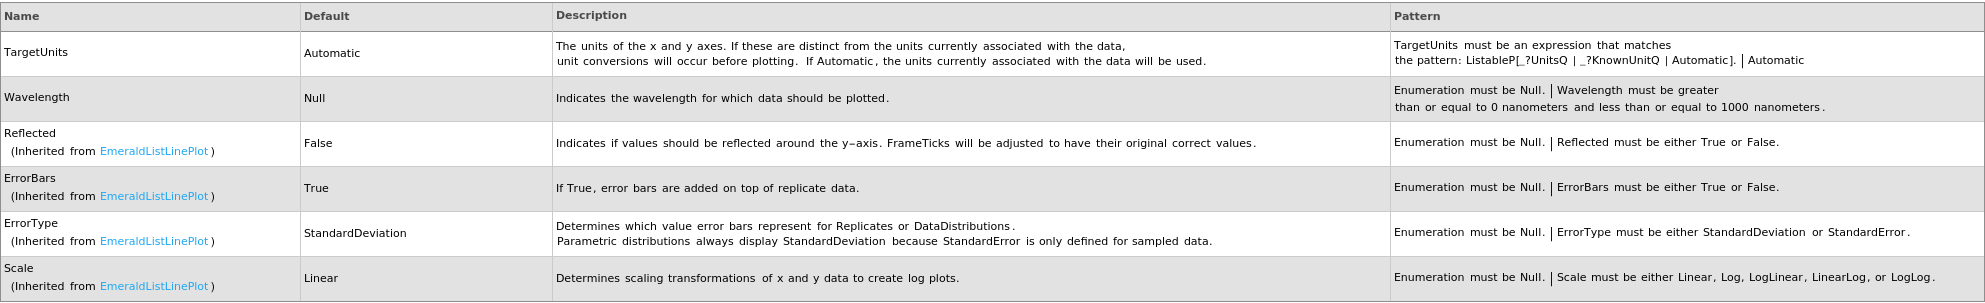
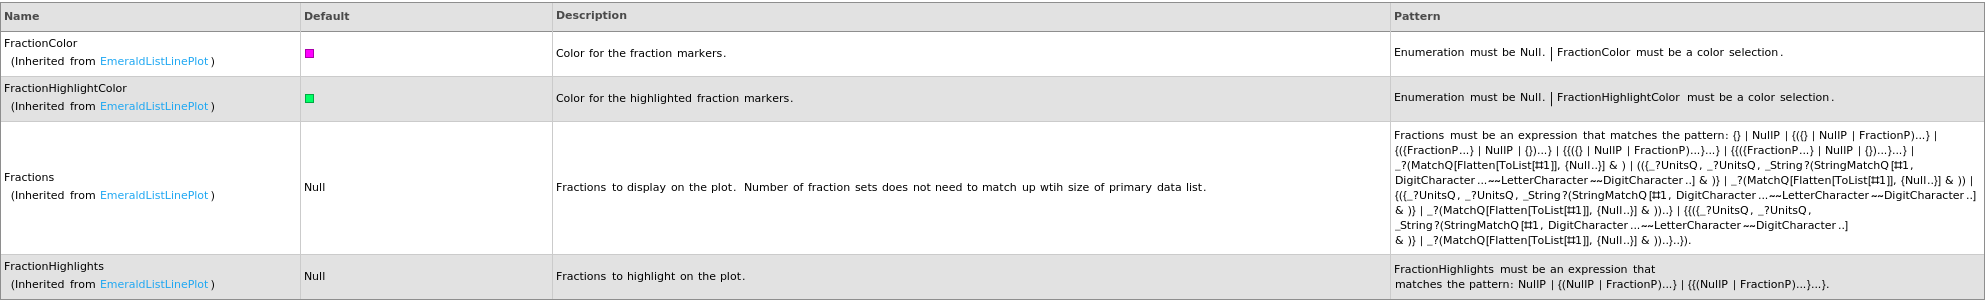
Fractions Options
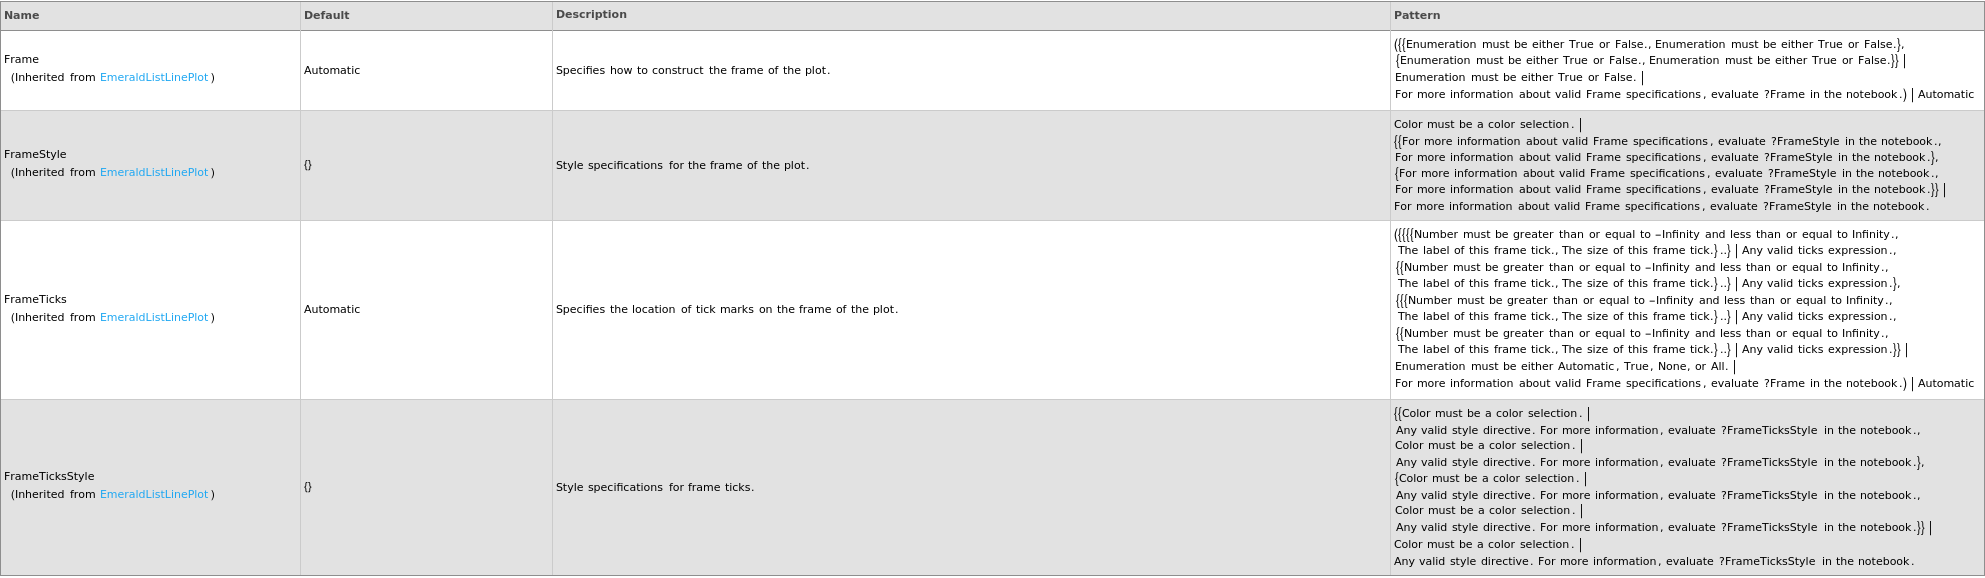
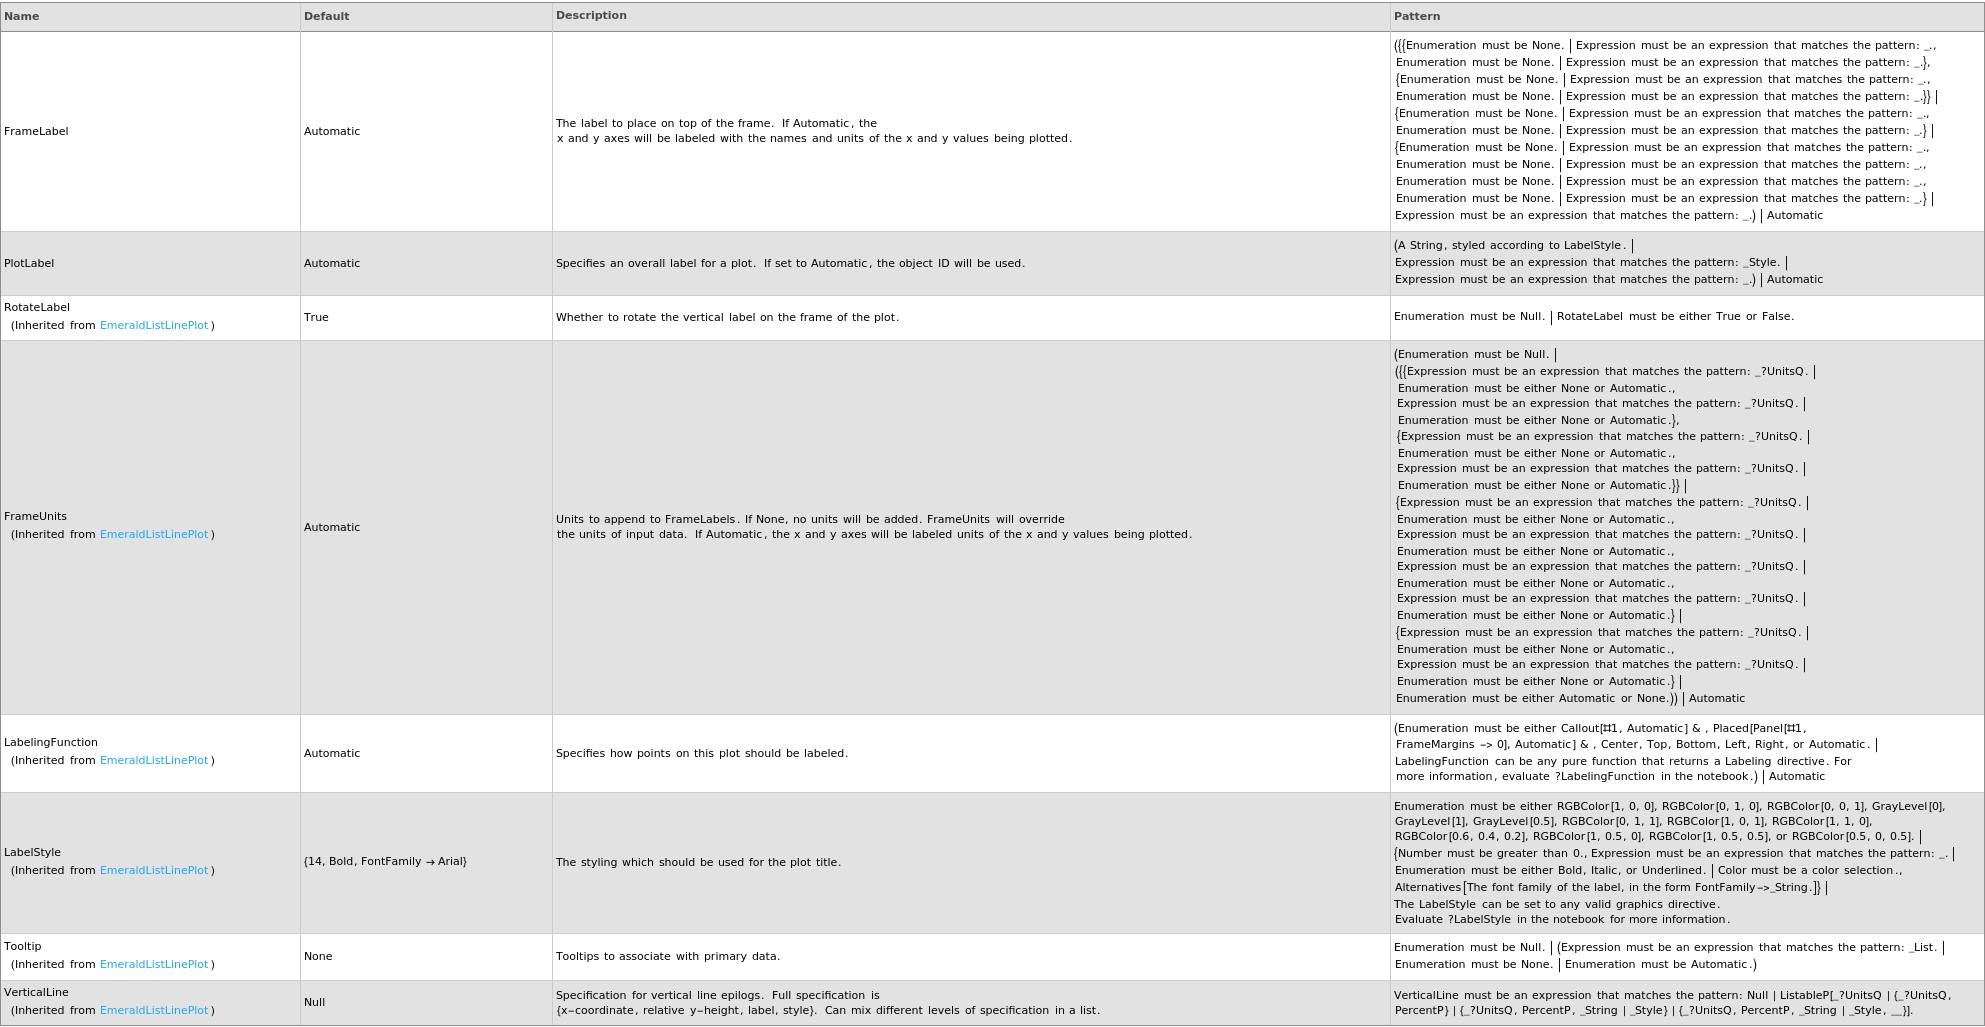
Frame Options
Grid Options
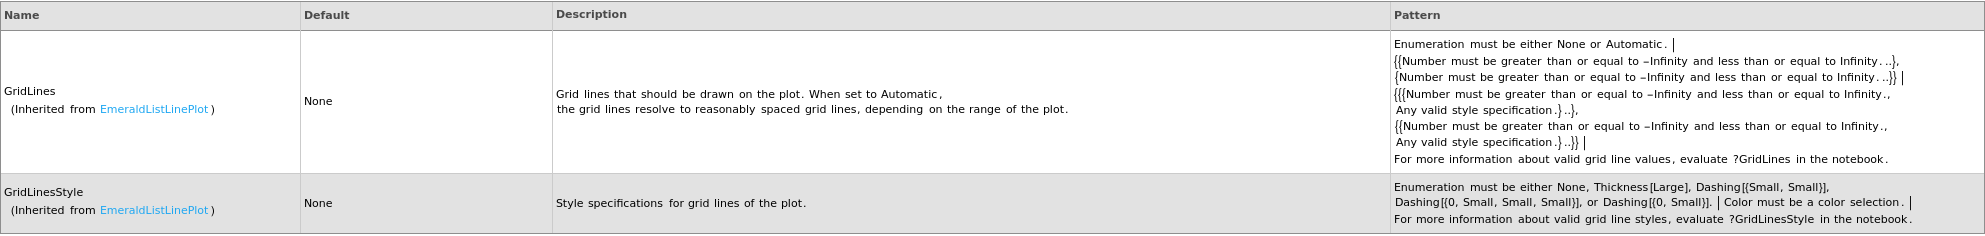
Image Format Options

Ladder Options

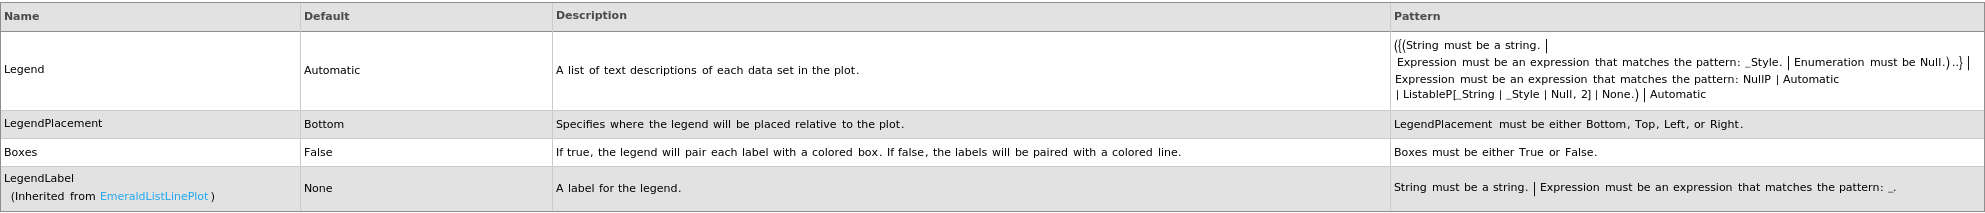
Legend Options
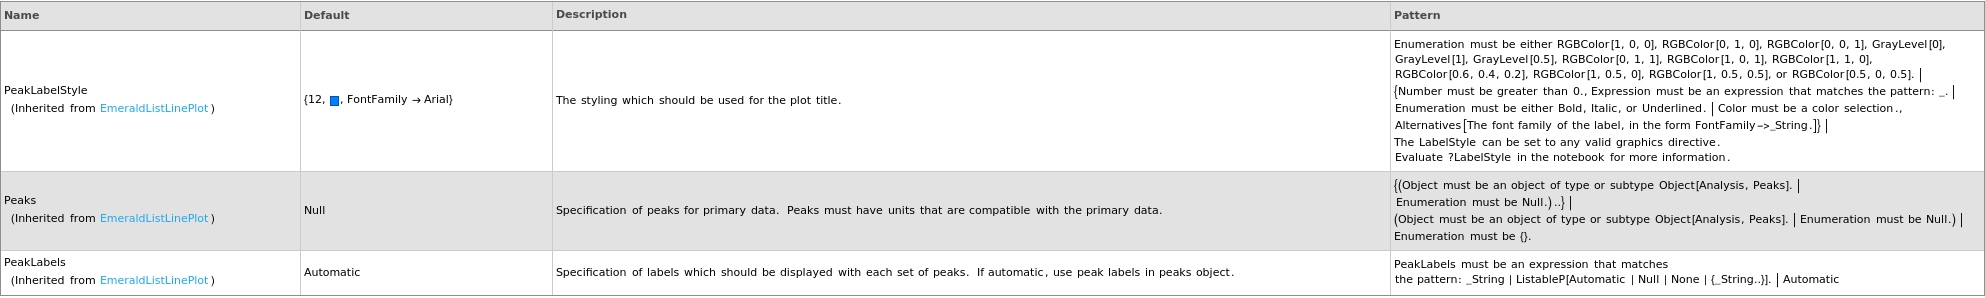
Peaks Options
Plot Labeling Options
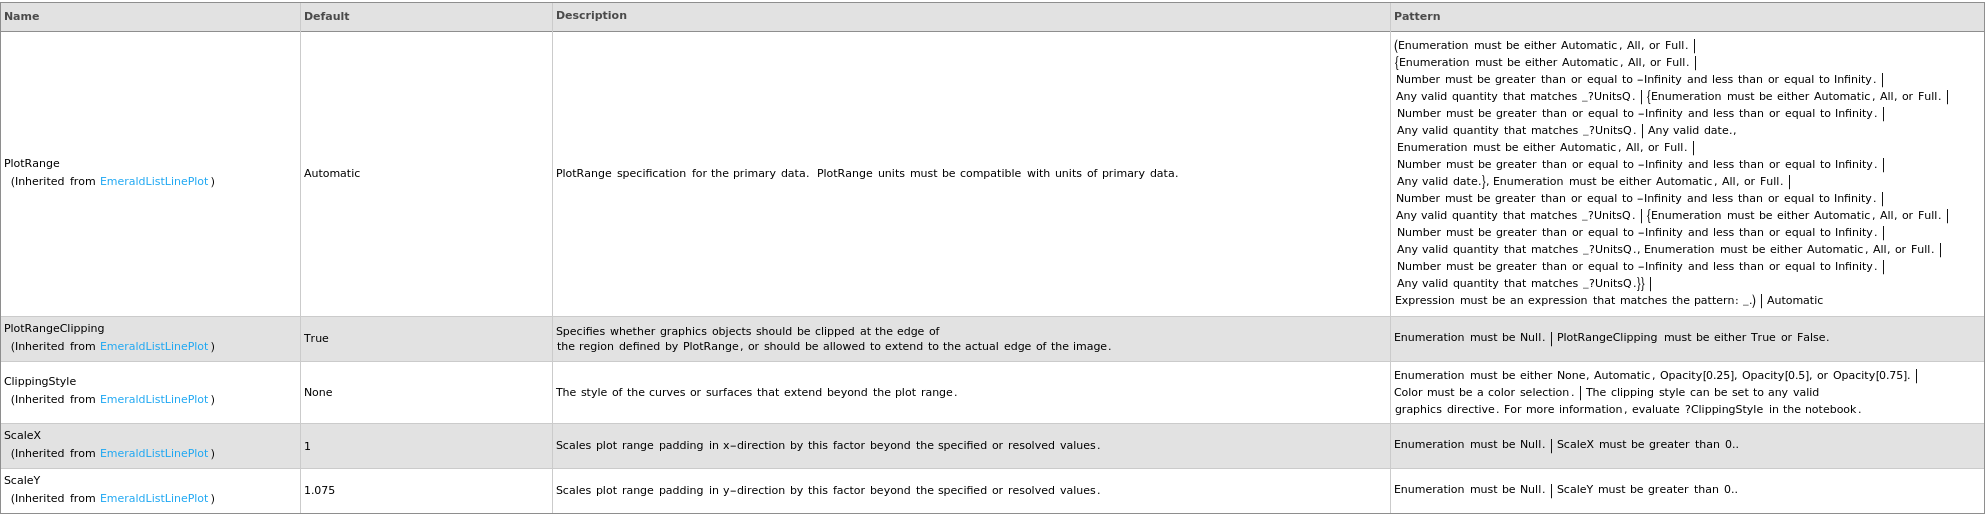
Plot Range Options
Plot Style Options
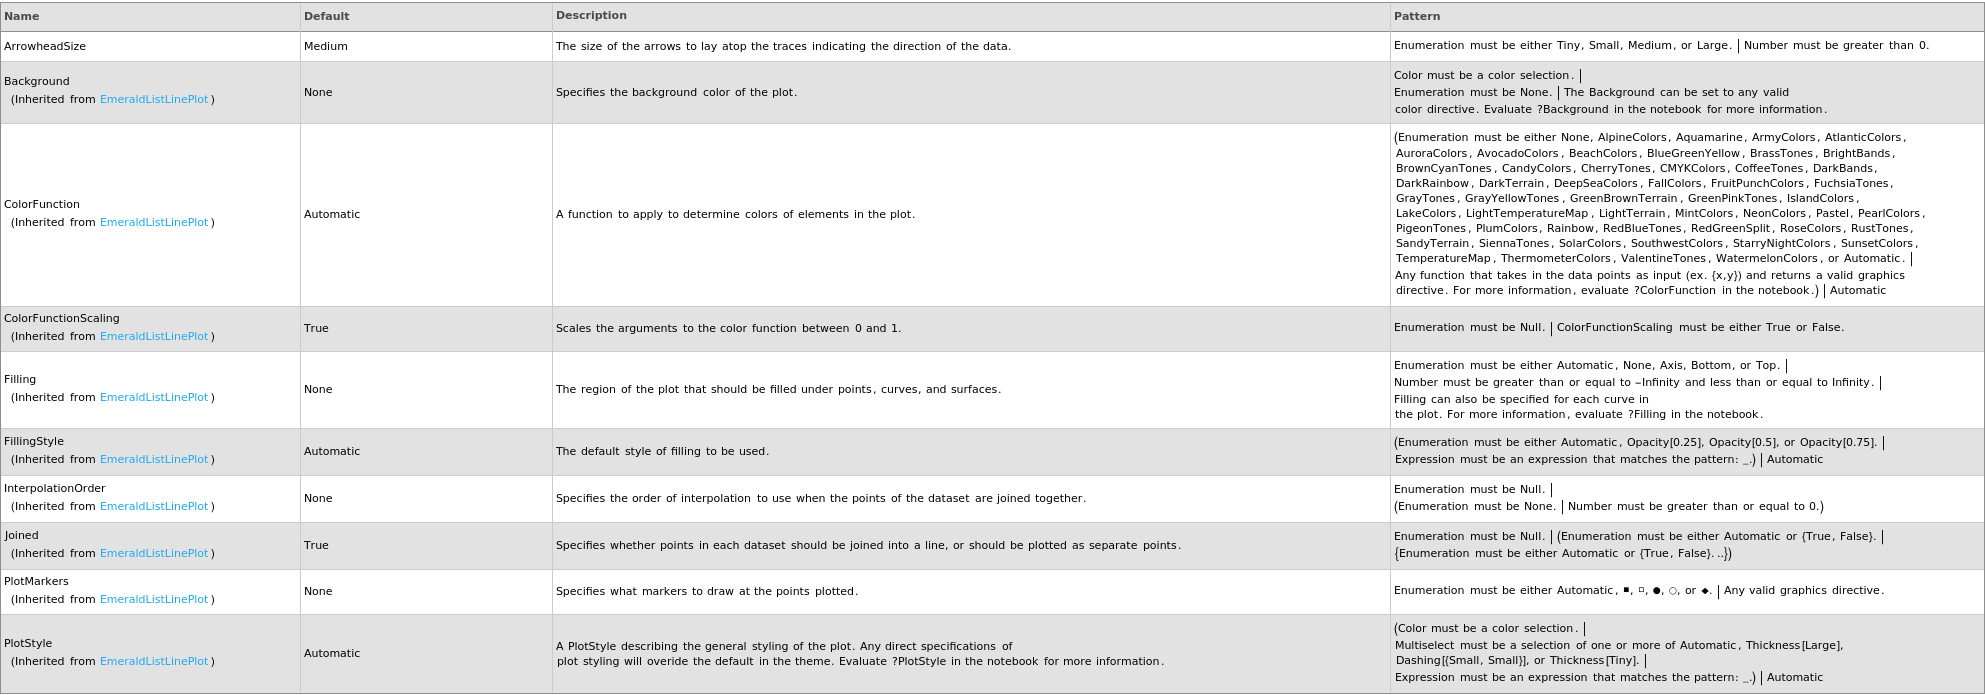
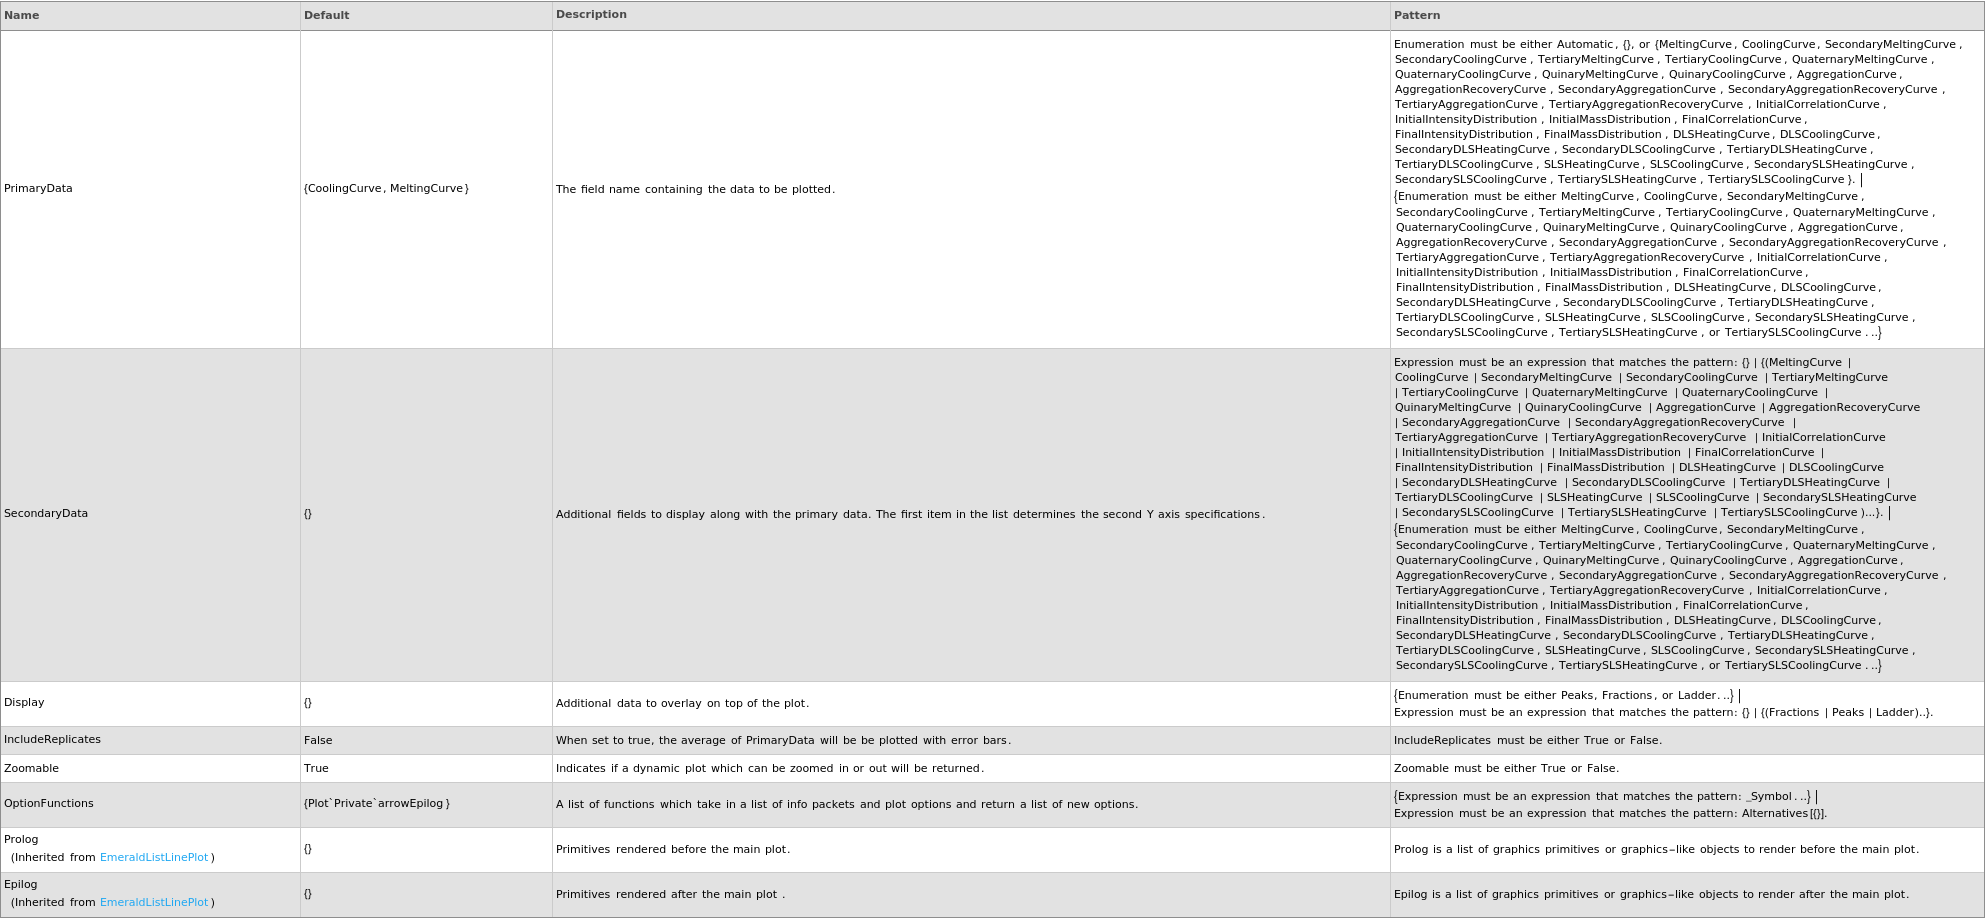
Primary Data Options

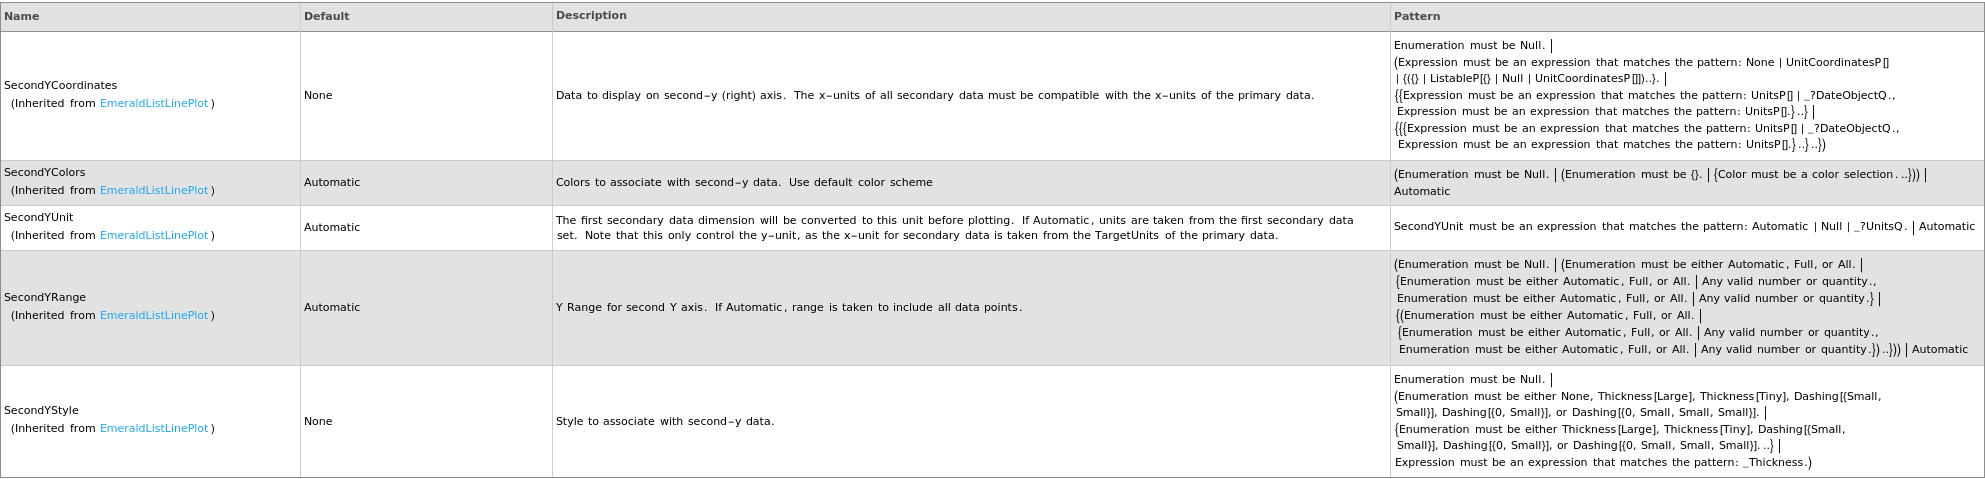
Secondary Data Options
General Options
Examples
open allclose allBasic Examples (7)
Plot only the cooling curve from the data object:
Plots absorbance thermodynamics object in a link:
Plots all primary data fields present in the absorbance thermodynamics data object:
Plots data objects linked to a protocol when given a ThermalShift protocol object:
Plots data objects linked to a protocol when given a UVMelting protocol object:
Plots the Melting and Cooling curve when both are present in the absorbance thermodynamics data object:


