PlotBindingQuantitation
PlotBindingQuantitation[AnalysisObject]⟹Plot
plots the bio-layer thickness during the quantitation step of a bio-layer interferometry assay.
PlotBindingQuantitation[DataObject]⟹Plot
plots the bio-layer thickness during the quantitation step of a bio-layer interferometry assay.
Details
Input

Output

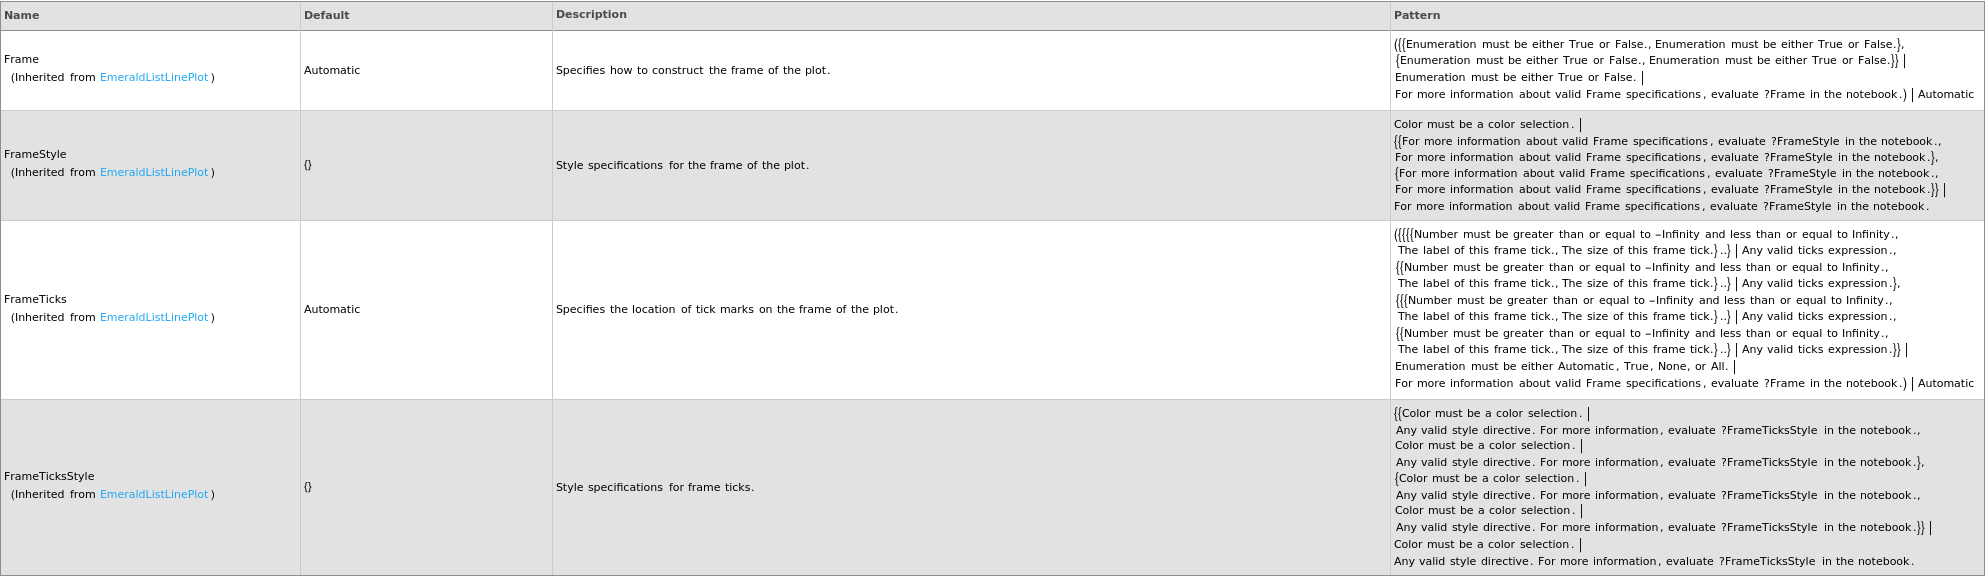
Frame Options
Grid Options
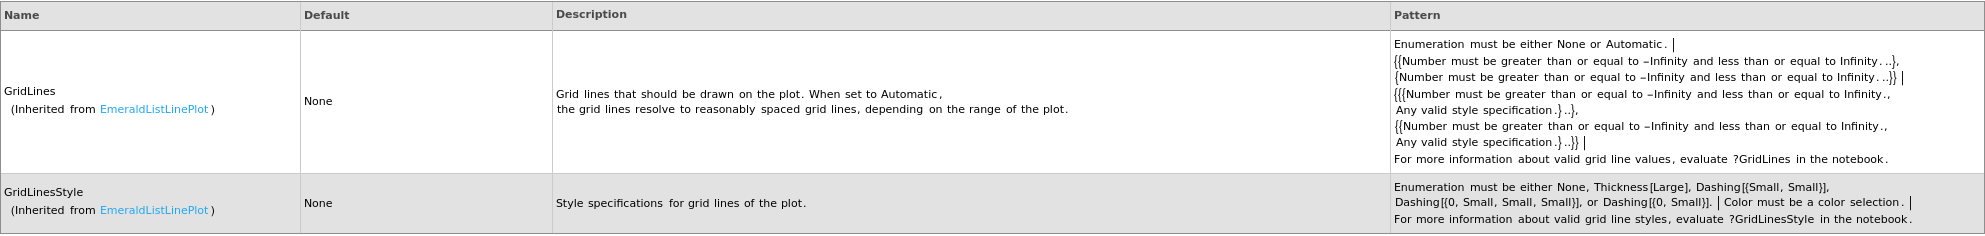
Image Format Options

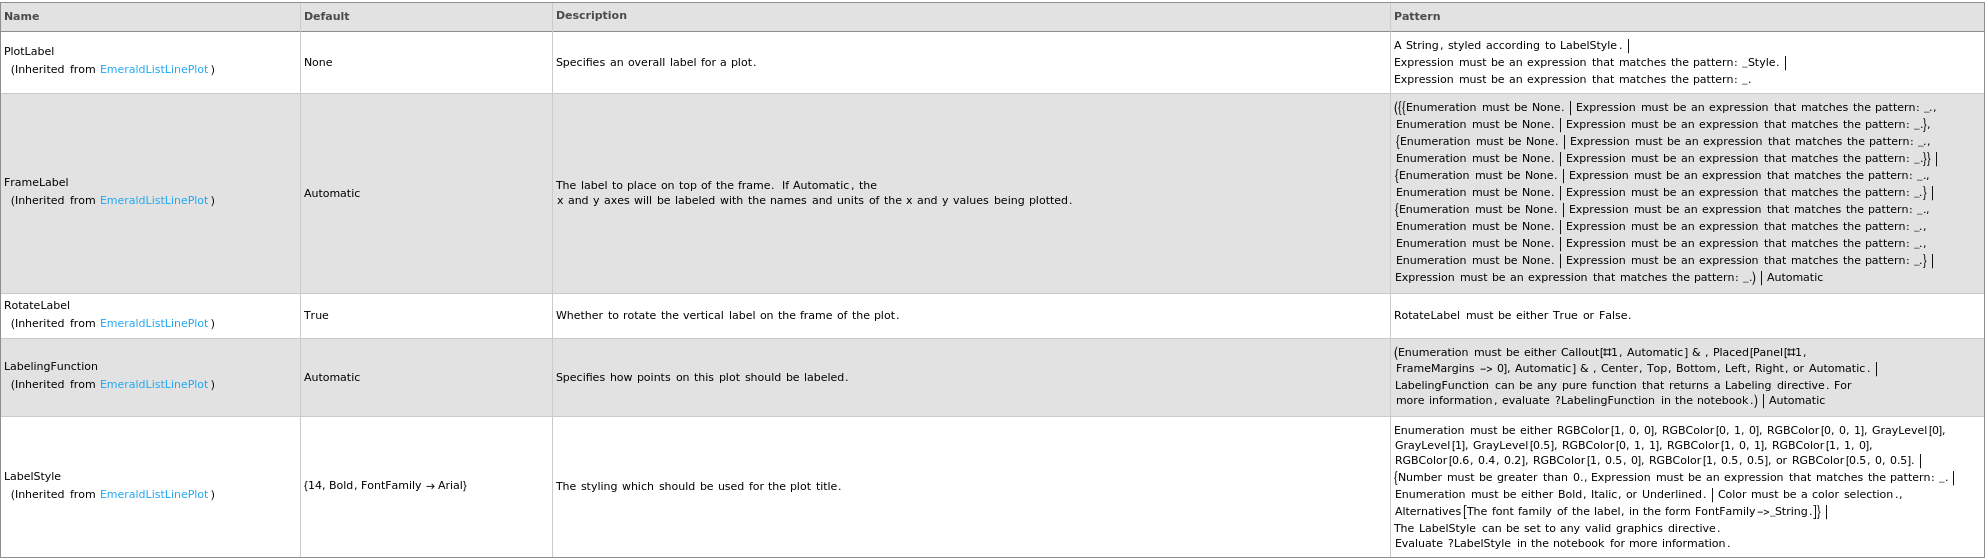
Plot Labeling Options
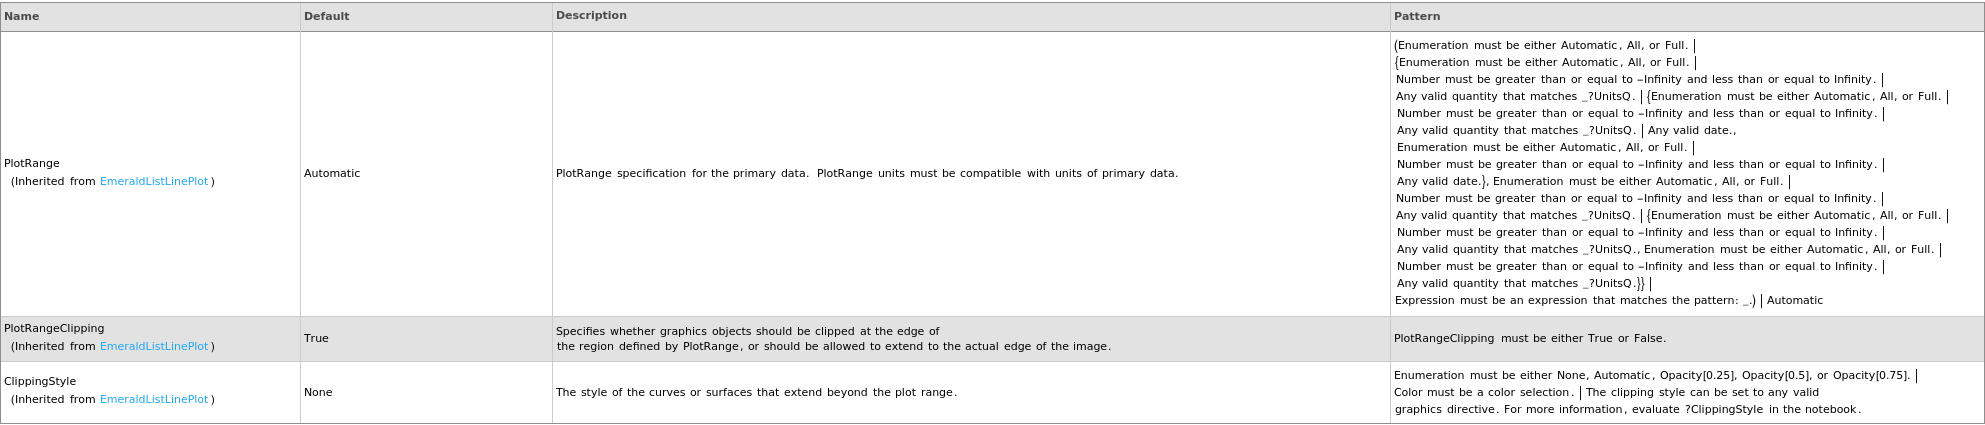
Plot Range Options
Plot Style Options
General Options

Examples
open allclose allBasic Examples (2)
Options (2)

Last modified on Wed 27 Aug 2025 17:18:24