PlotDifferentialScanningCalorimetry
PlotDifferentialScanningCalorimetry[DSCData]⟹Plot
provides a graphical plot of the provided DSCData -- differential scanning calorimetry (DSC) spectra.
PlotDifferentialScanningCalorimetry[Protocol]⟹Plot
creates a Plot of the differential scanning calorimetry data found in the Data field of Protocol.
PlotDifferentialScanningCalorimetry[HeatingData]⟹Plot
provides a graphical plot the provided 'heatingCurves'.
Details
Input

Output

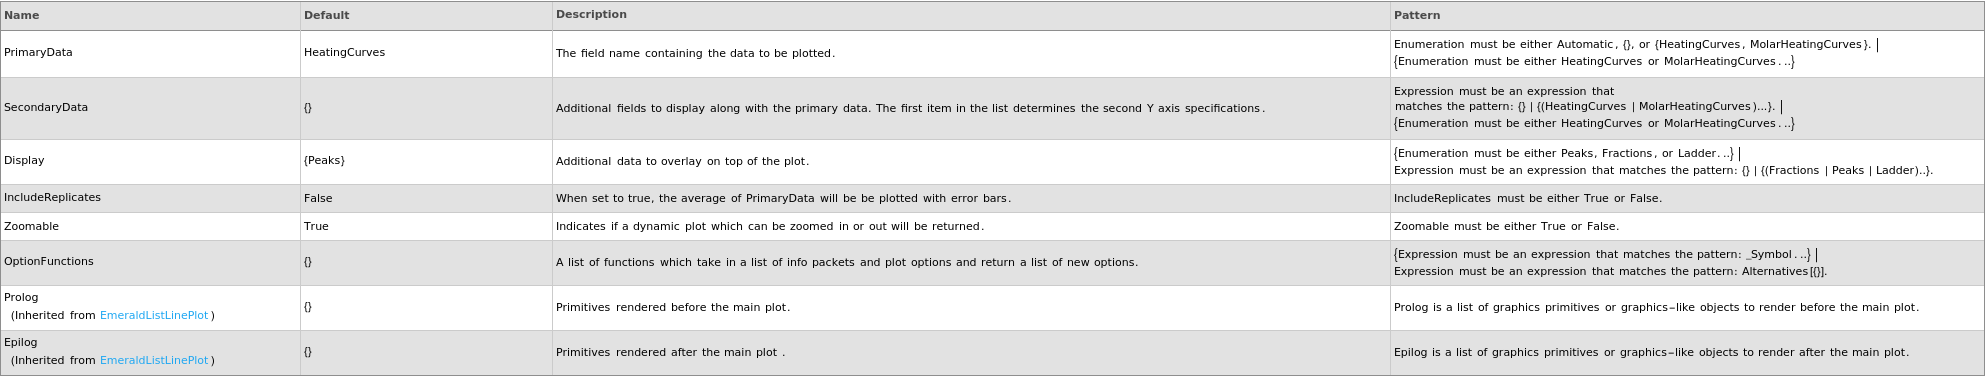
Data Specifications Options

Frame Options
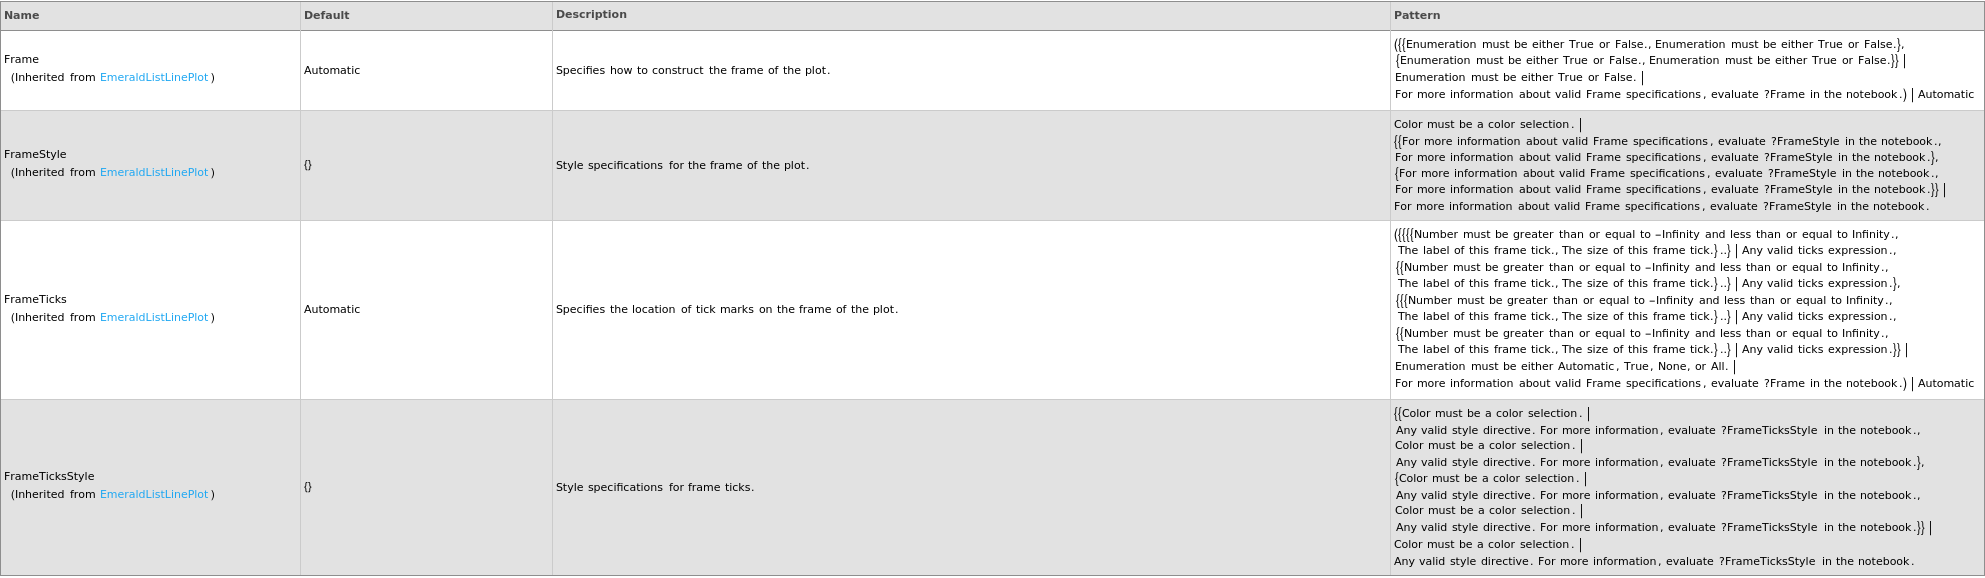
Grid Options
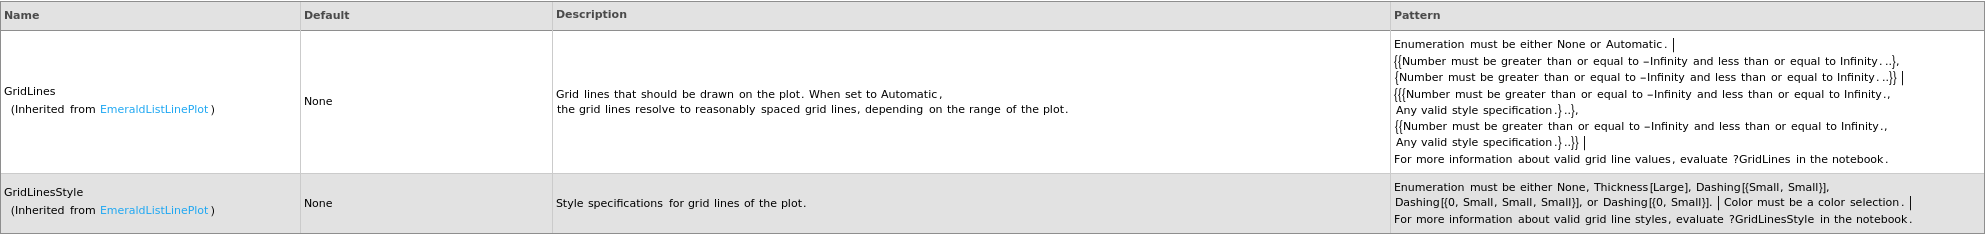
Image Format Options

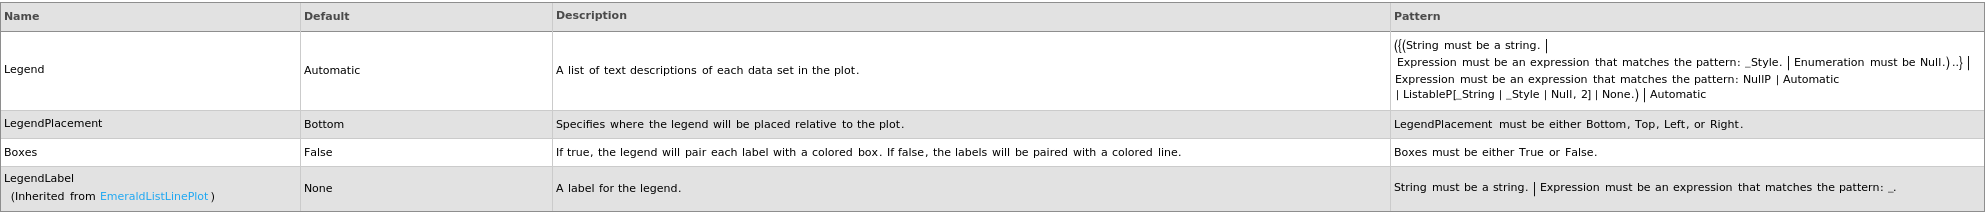
Legend Options
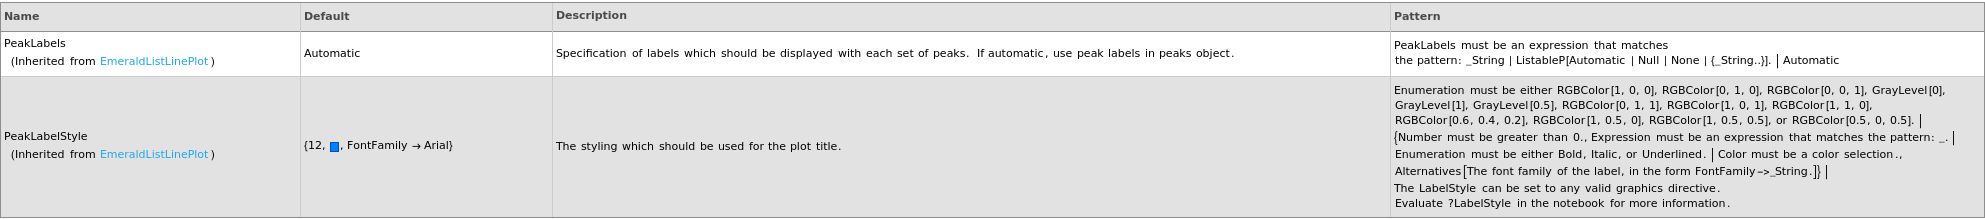
Peaks Options
Plot Labeling Options
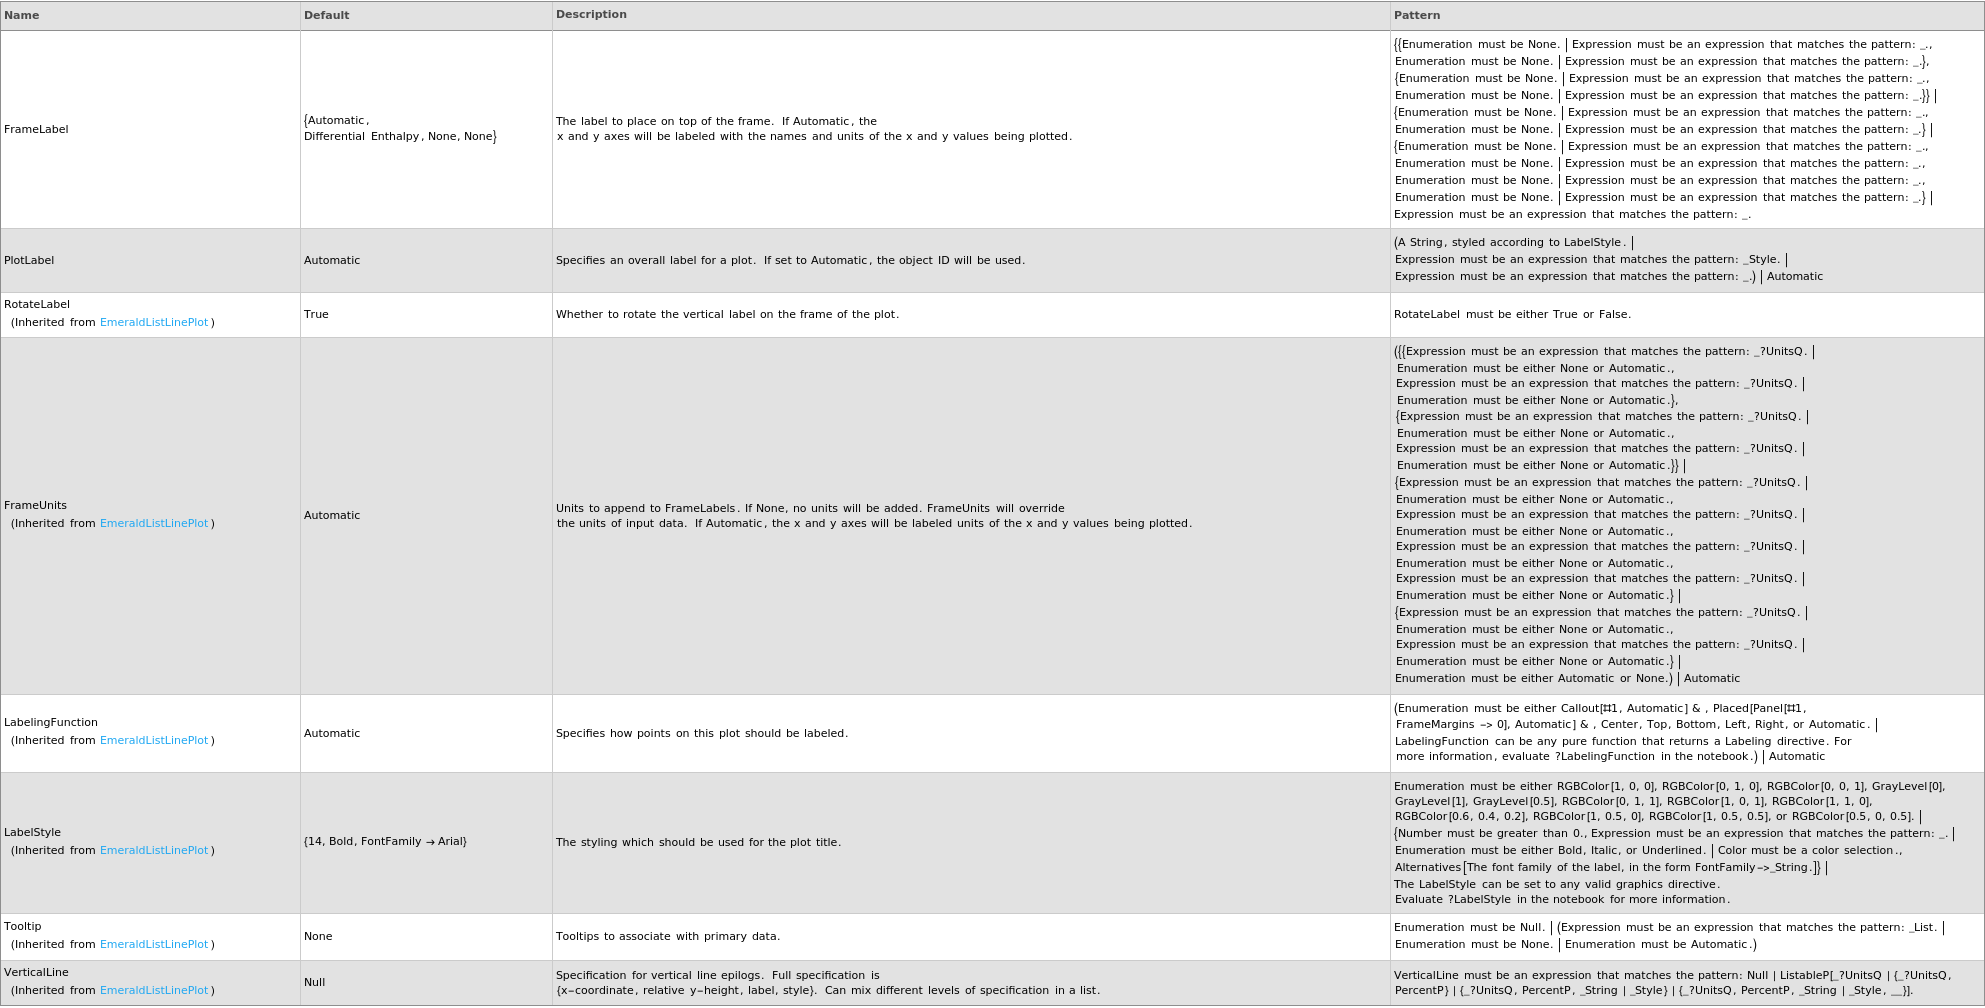
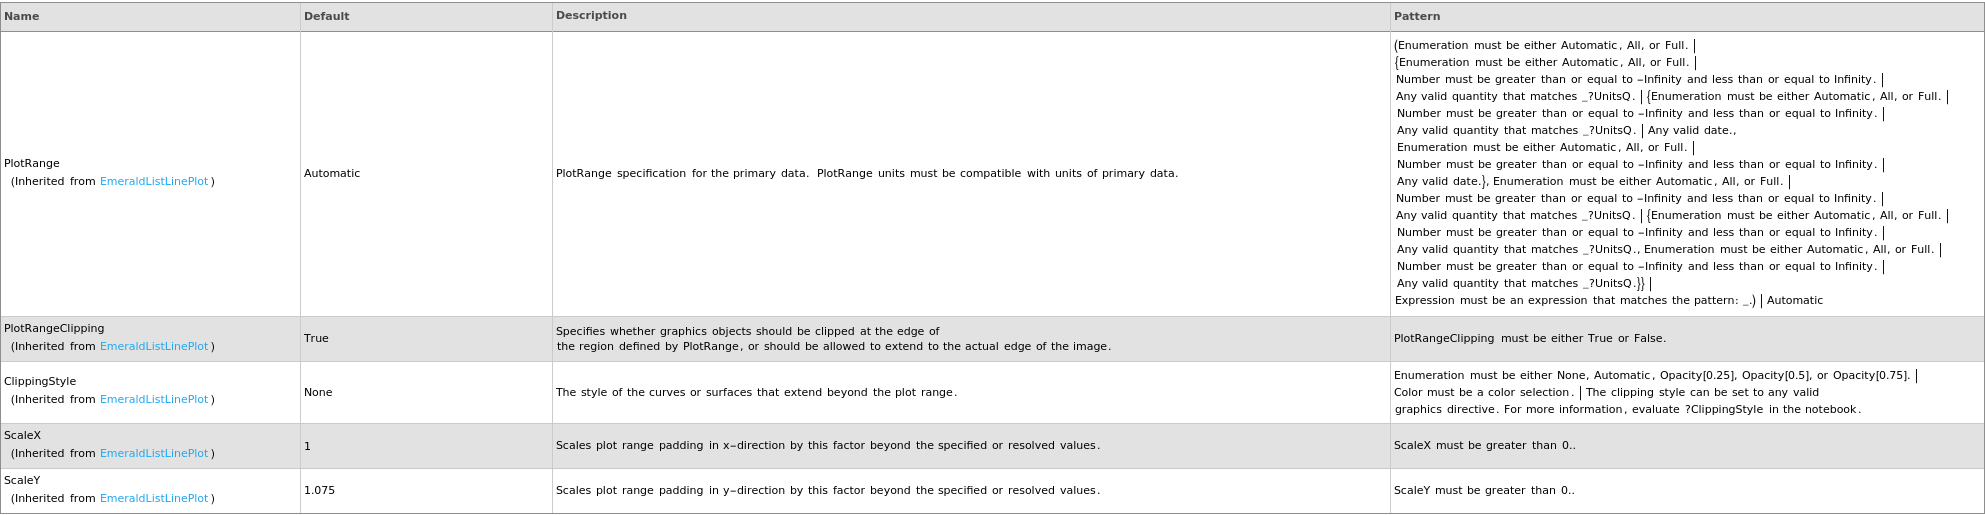
Plot Range Options
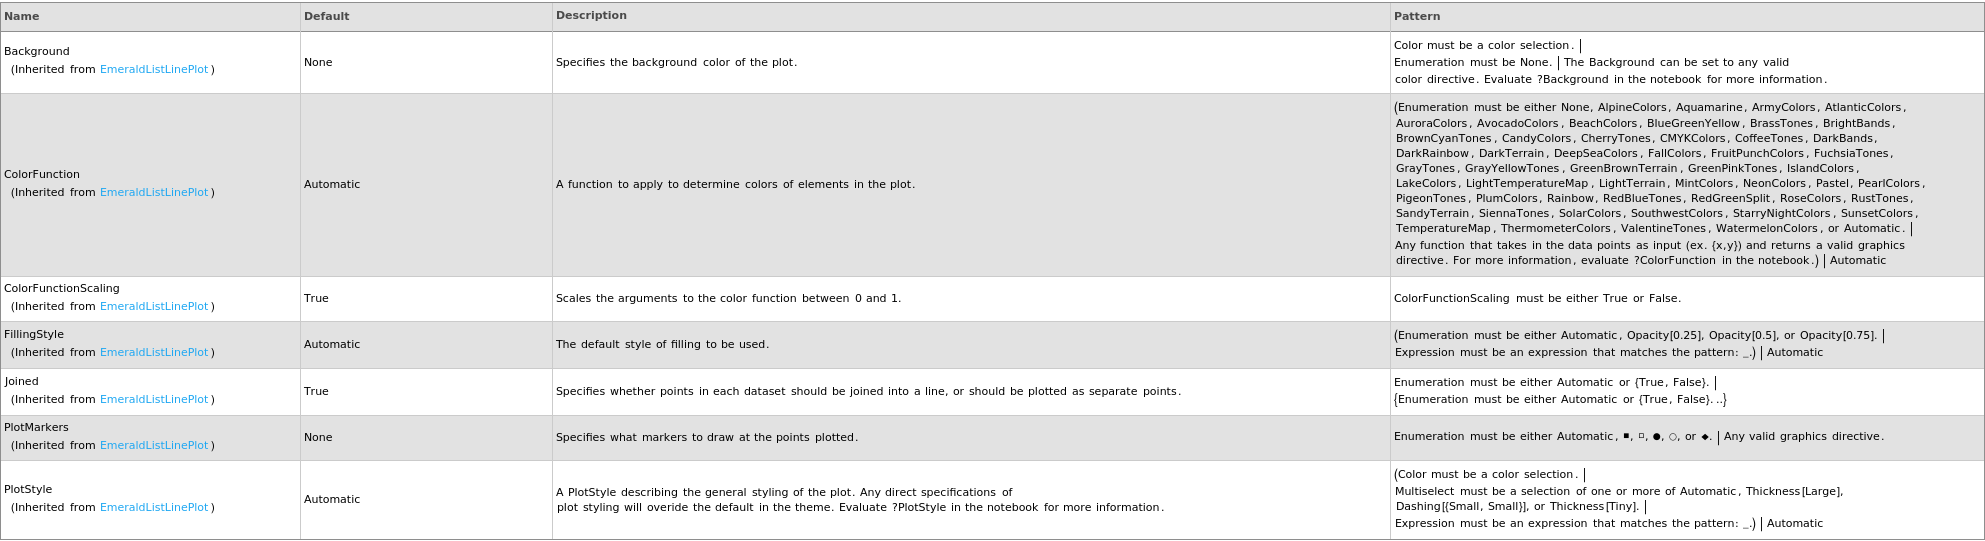
Plot Style Options
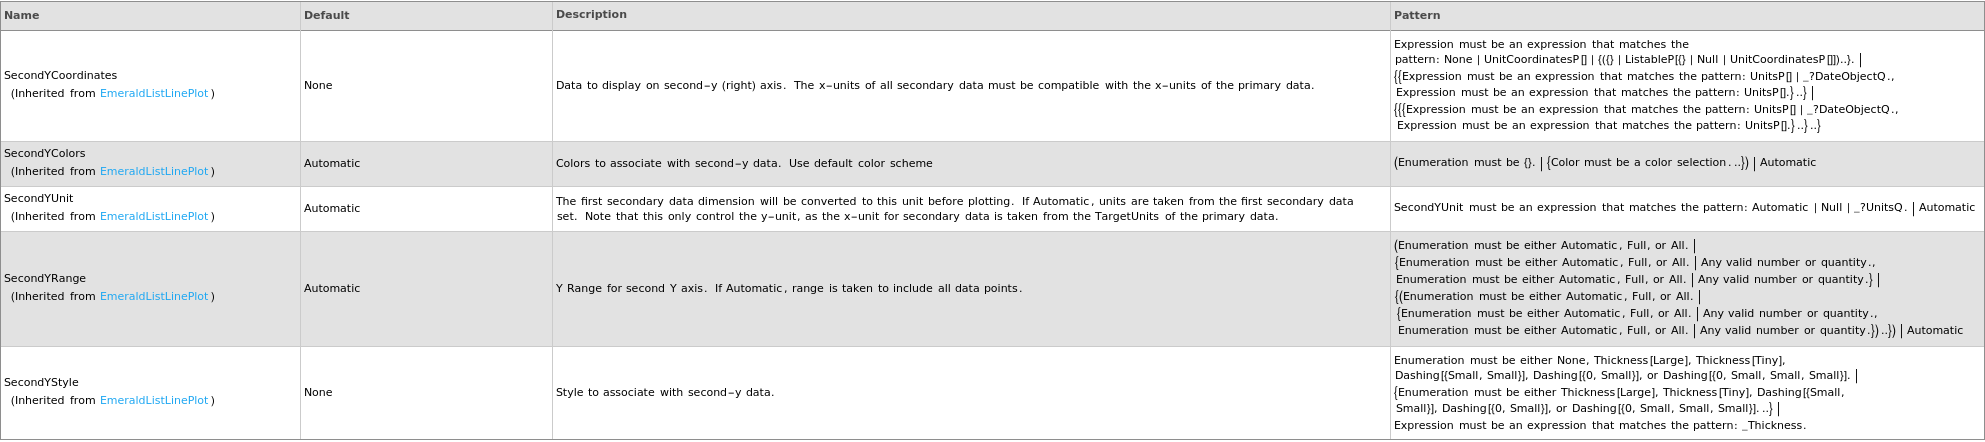
Secondary Data Options
General Options
Examples
open allclose allBasic Examples (3)
Options (19)
Boxes (1)
HeatingCurves (1)
MolarHeatingCurves (1)
Output (1)
PlotTheme (1)
SecondaryData (1)
TargetUnits (1)
Last modified on Wed 8 Oct 2025 09:50:18