PlotDynamicLightScattering
PlotDynamicLightScattering[DlsDataObject]⟹Plot
plots the `dlsDataObject` data as a list line plot.
PlotDynamicLightScattering[Protocol]⟹Plot
creates a Plot of the data found in the Data field of Protocol.
PlotDynamicLightScattering[Coordinates]⟹Plot
the xy points making up the spectrum to be plotted.
PlotDynamicLightScattering[MeltingCurveObject]⟹Plot
plots the initial and final particles size distributions from the MeltingCurveObject data.
Details
Input

Output

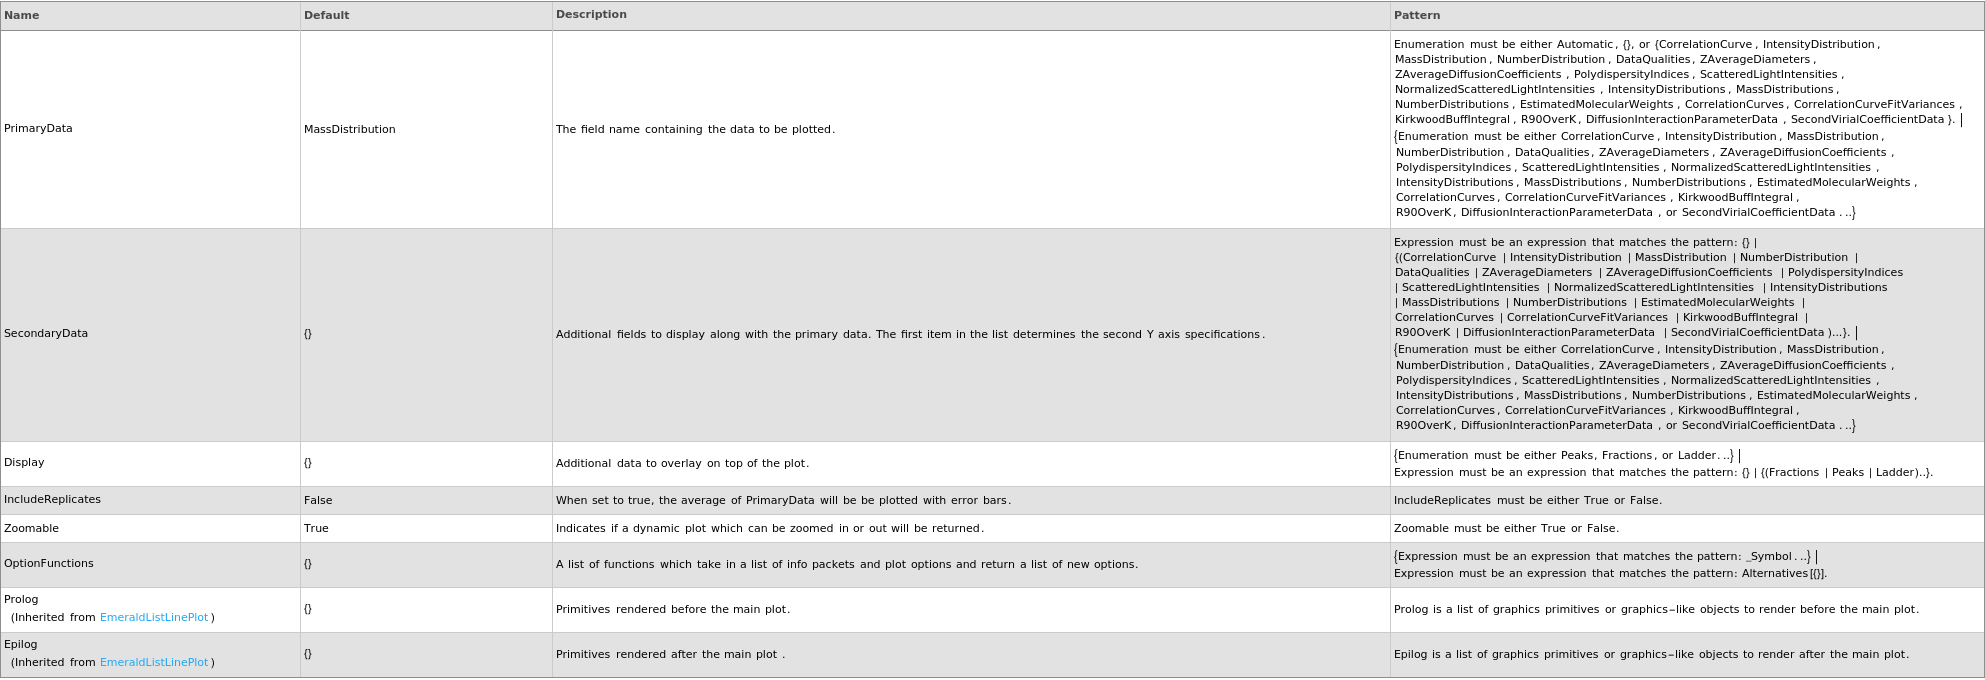
Data Specifications Options
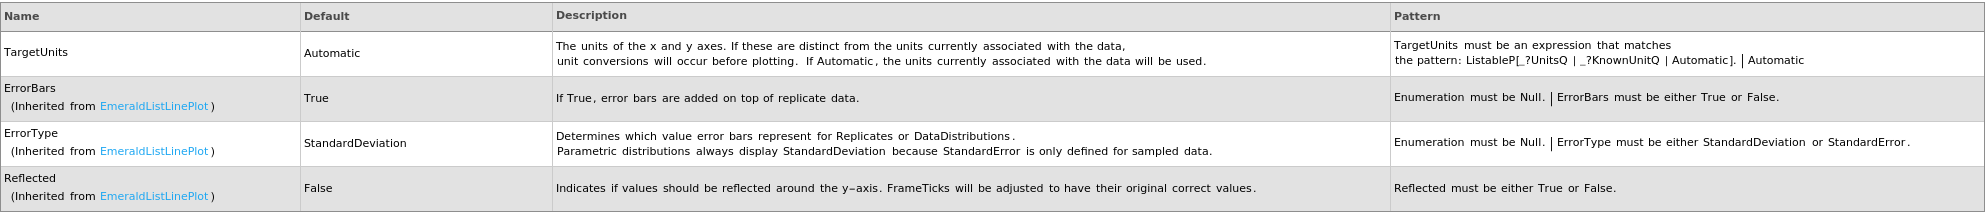
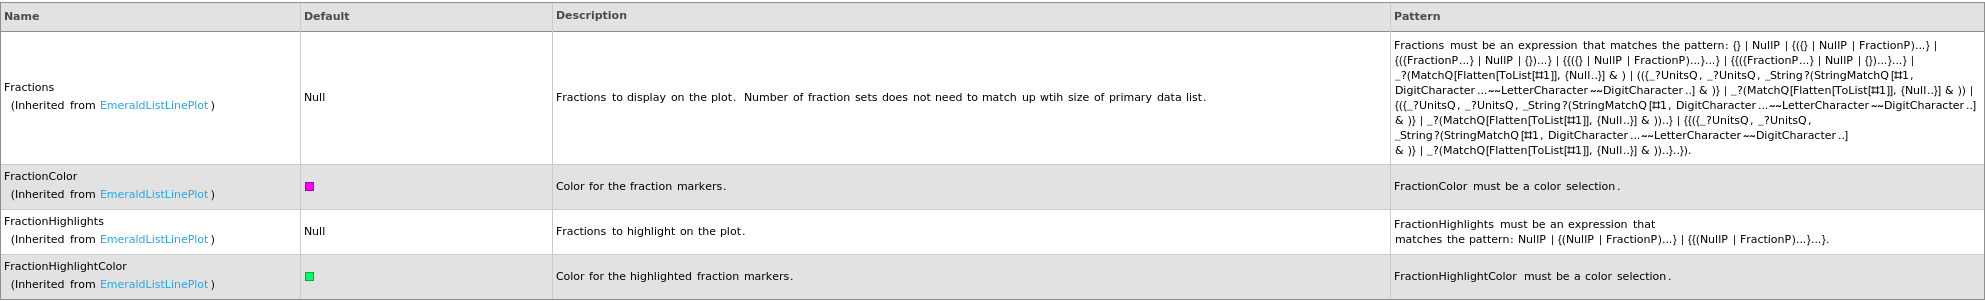
Fractions Options
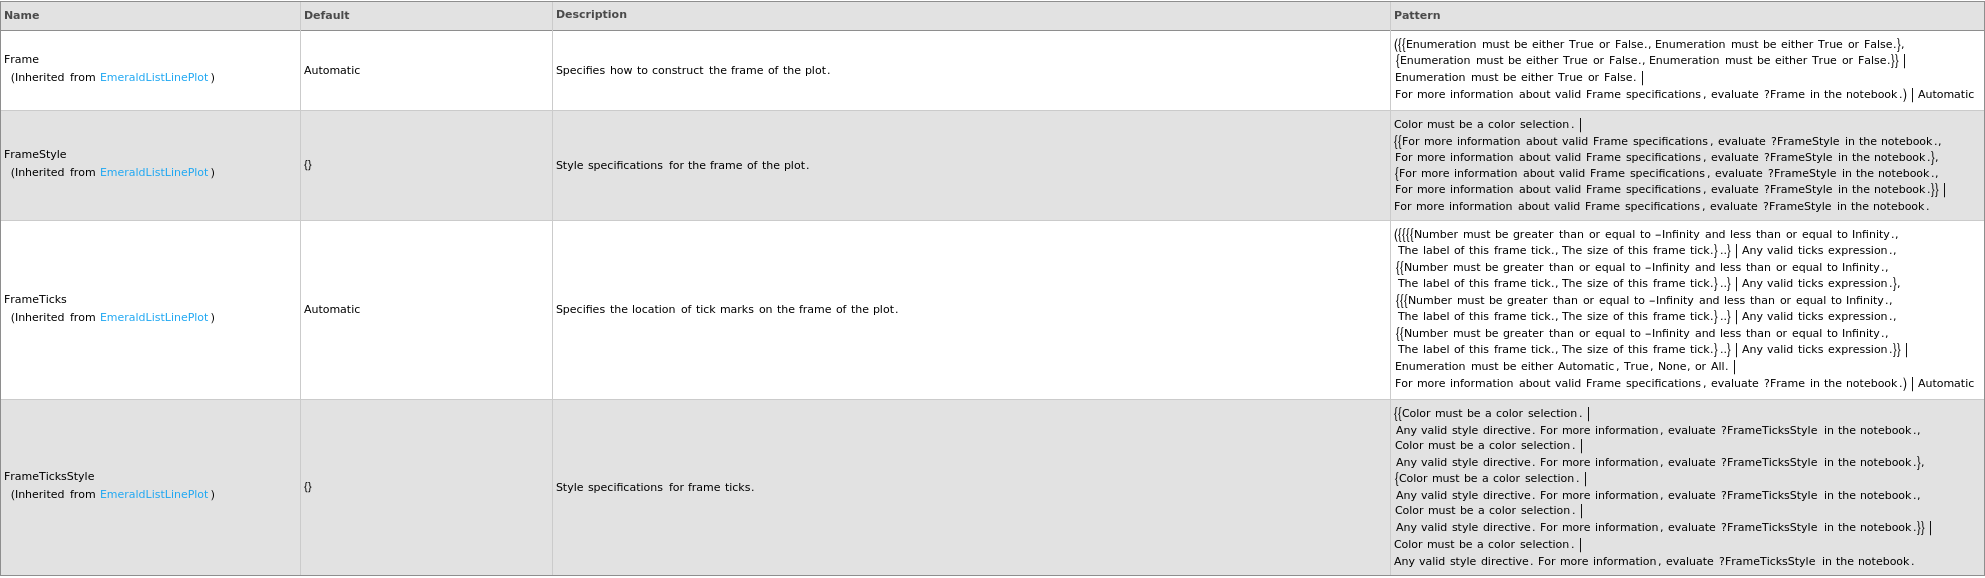
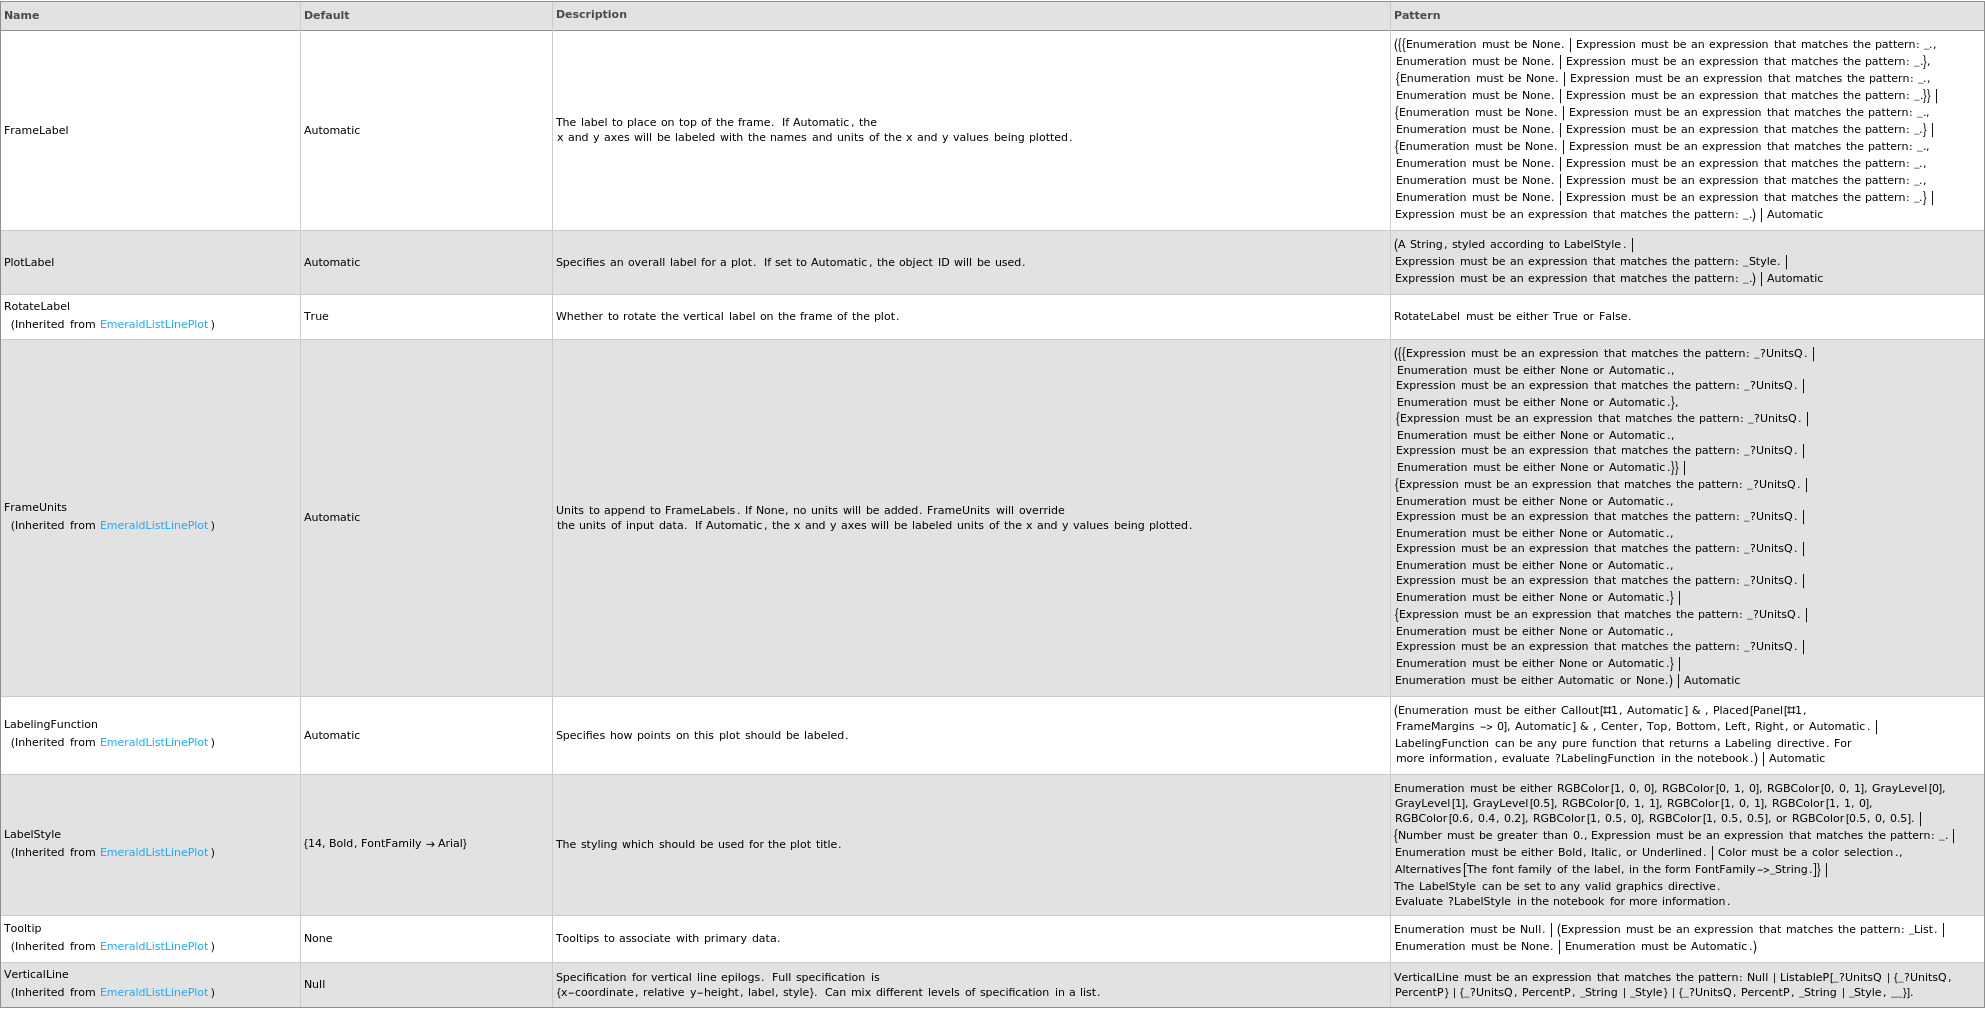
Frame Options
Grid Options
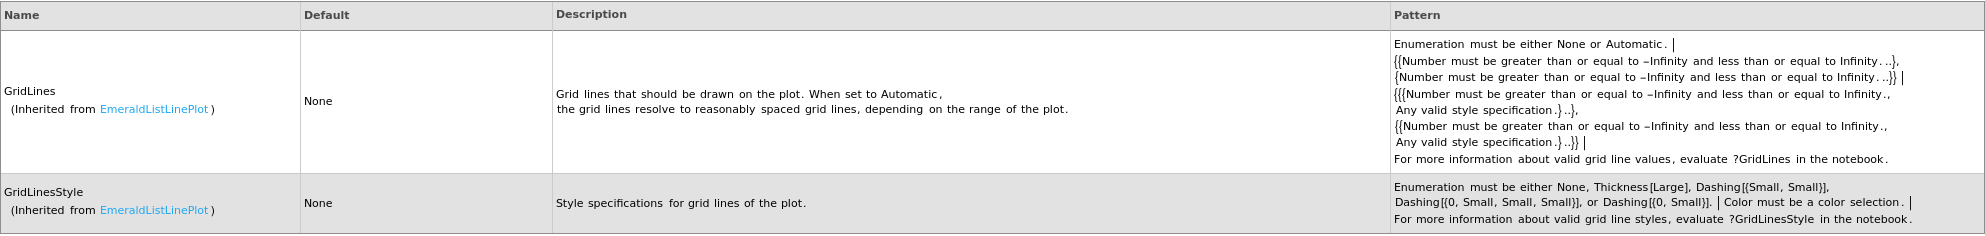
Image Format Options

Ladder Options

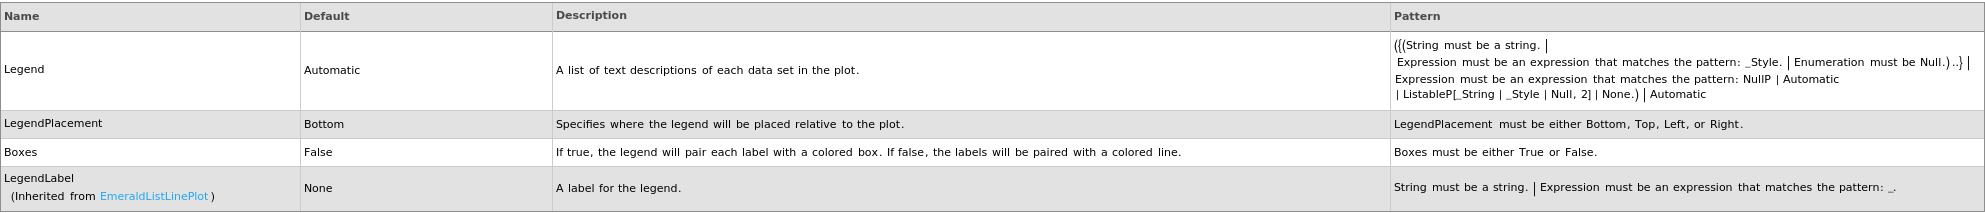
Legend Options
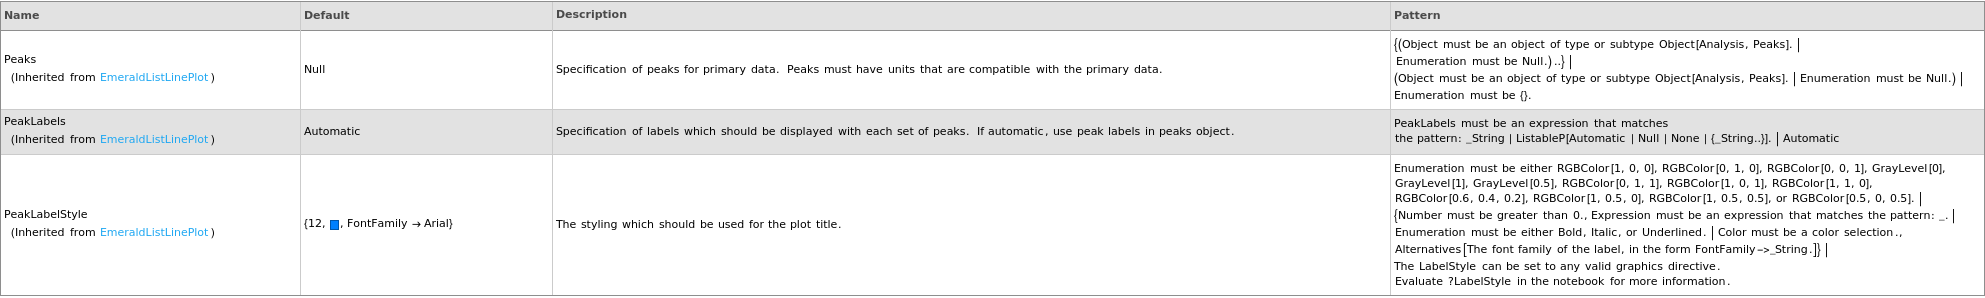
Peaks Options
Plot Labeling Options
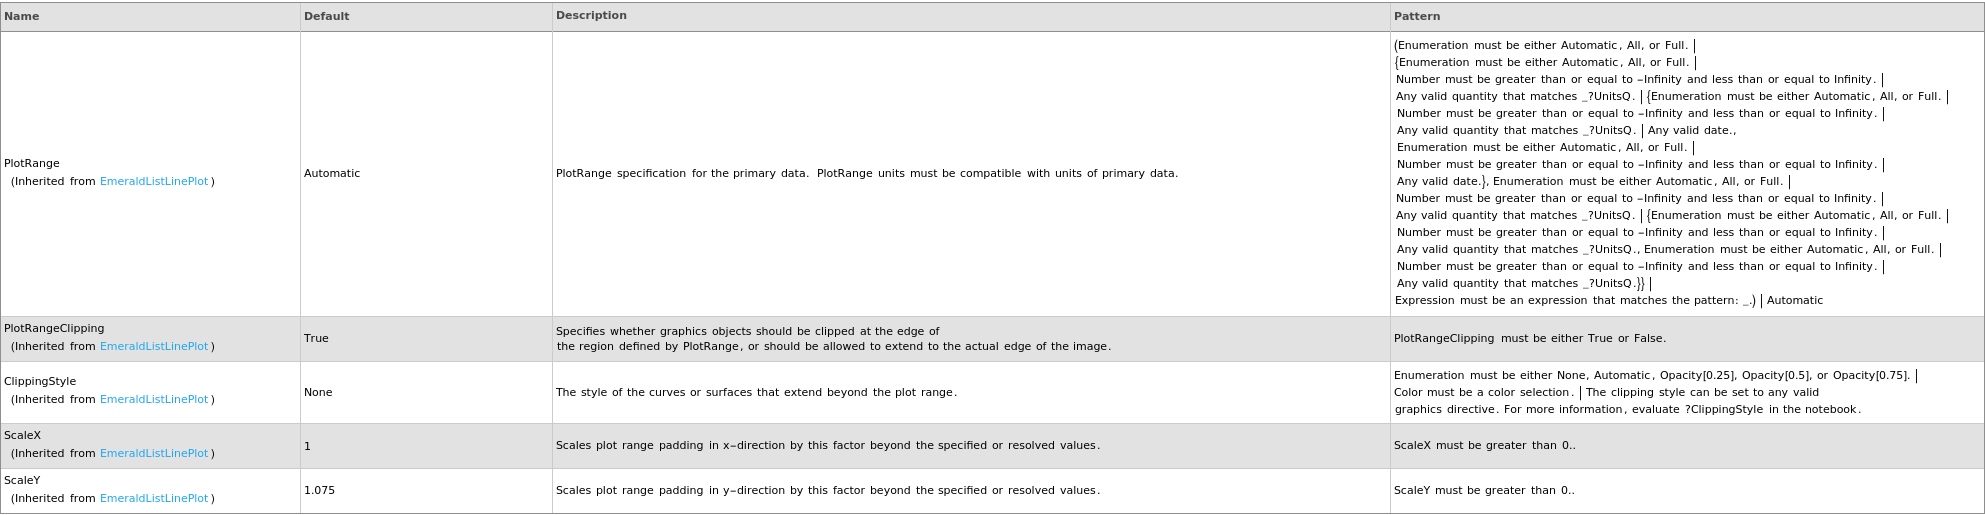
Plot Range Options
Plot Style Options
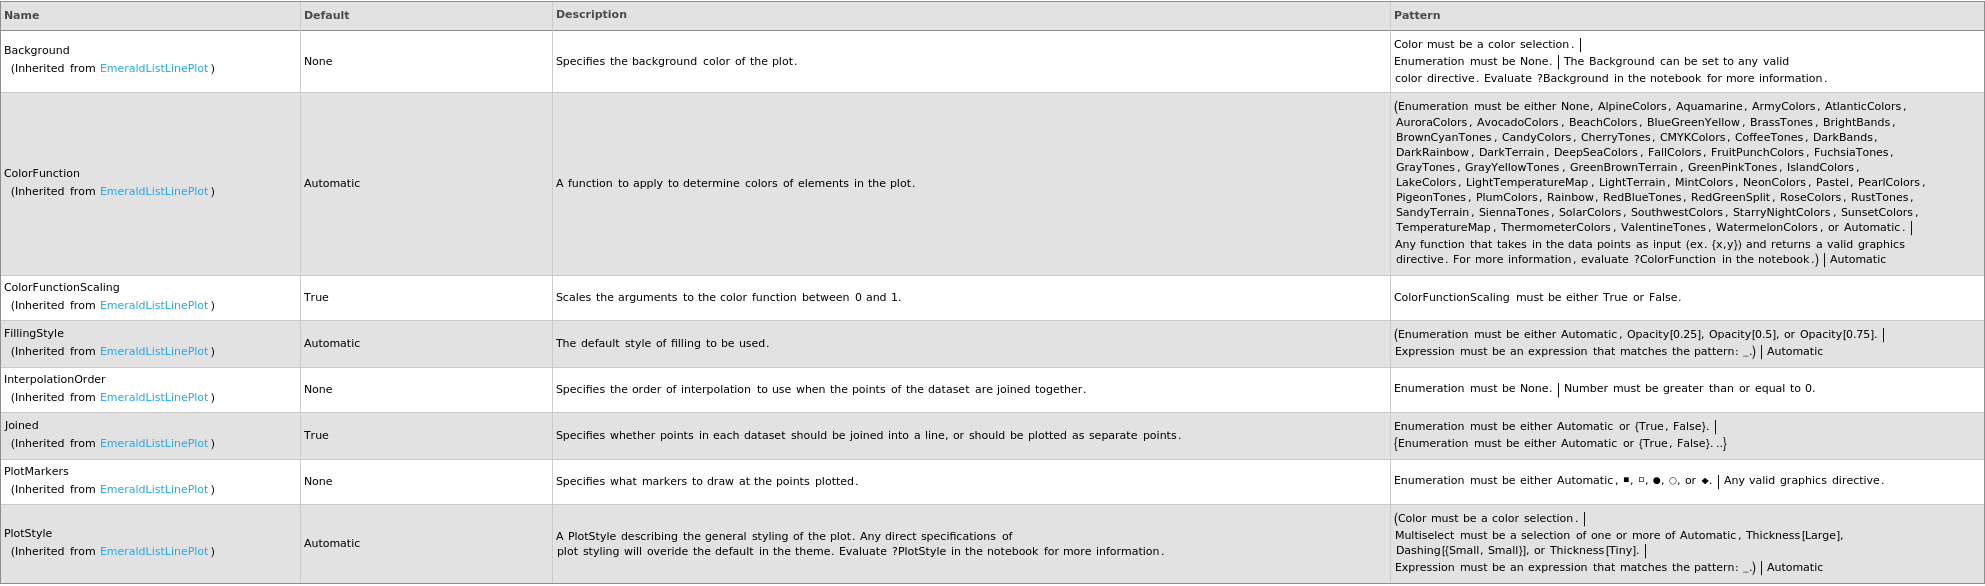
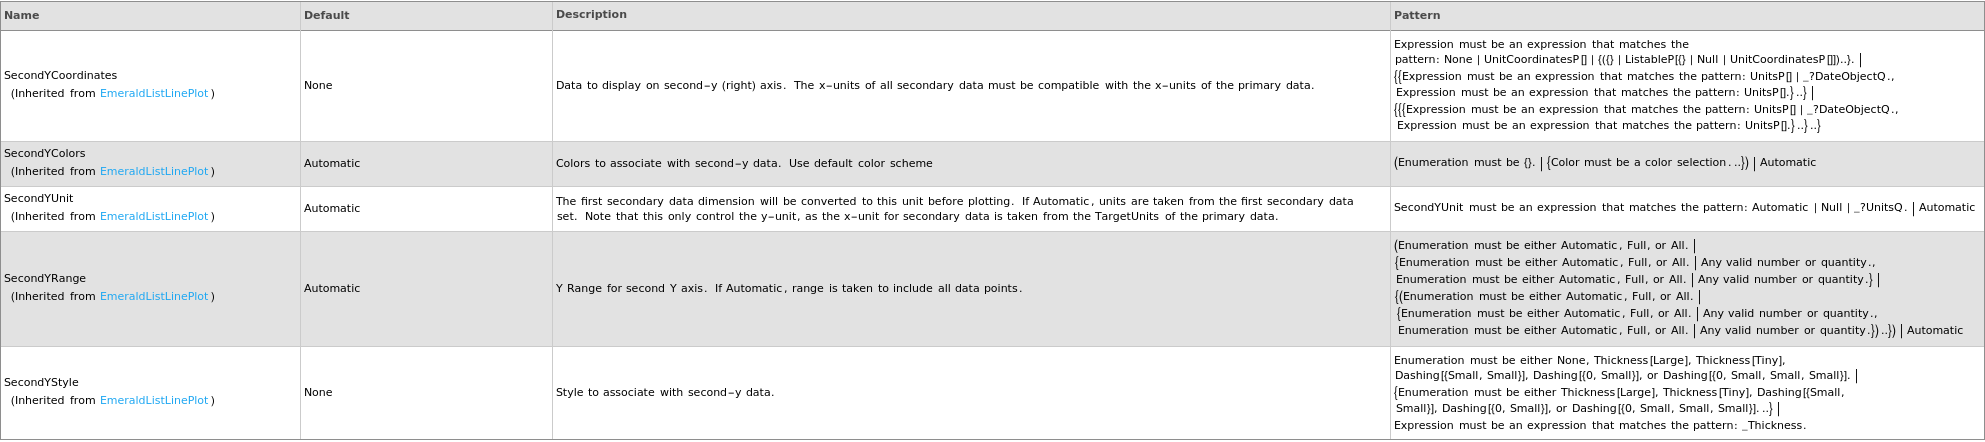
Secondary Data Options
General Options
Examples
open allclose allBasic Examples (5)
Given a DynamicLightScattering data object, creates a plot for the MassDistribution if AssayType is SizingPolydispersity, ZAverageDiameters if the AssayType is IsothermalStability, KirkwoodBuffIntegral if the AssayType is G22, and PolydispersityIndicies if the AssayType is B22kD:
Given a DynamicLightScattering protocol object, creates a plot of the linked data objects:
Return a dynamic figure when Output->Preview:
Additional Examples (3)
Plot dynamic light scattering data for multiple Object[Data, MeltingCurve] to create a slideview for each data object:
Plot dynamic light scattering data for Object[Data, MeltingCurve] and use secondary data to plot additional information:
Plot dynamic light scattering data from Object[Data, MeltingCurve] if it contains dynamic light scattering data:
