PlotFit
PlotFit[Xy, F]⟹Plot
overlays the fitted function F[x] on the data points Xy.
PlotFit[Fit]⟹Plot
overlays the fitted function from the Fit object onto the data points used to construct the fit.
Details
Input

Output

Data Specifications Options

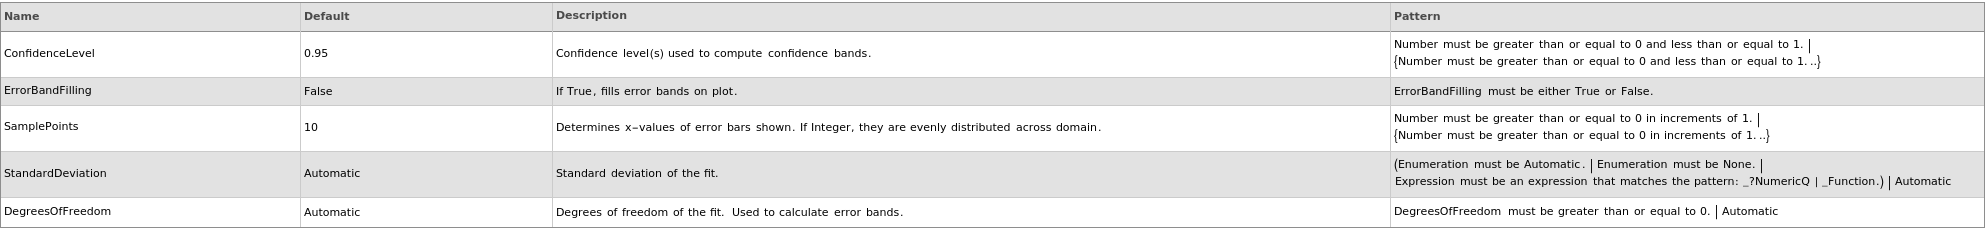
Error Bands Options
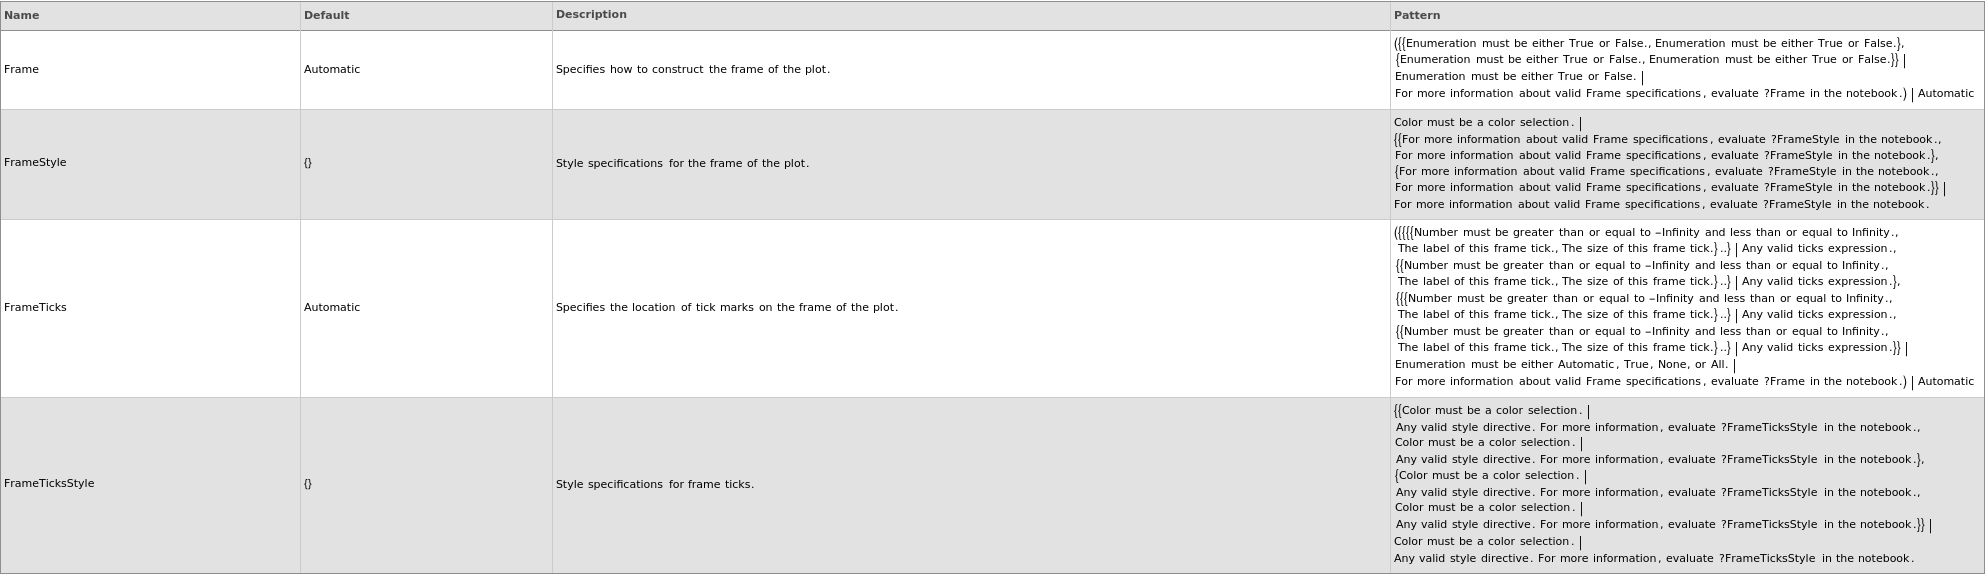
Frame Options
Grid Options
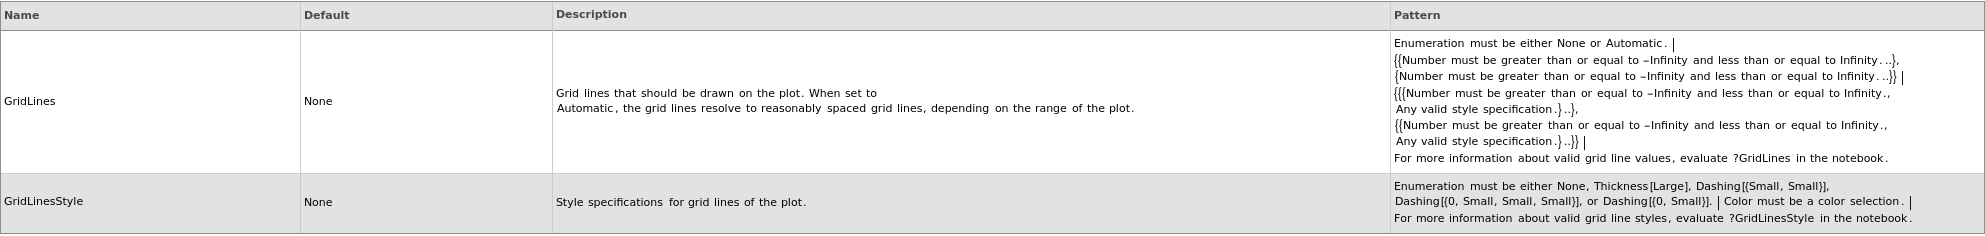
Image Format Options

Legend Options

Outliers Options

Plot Fit Options

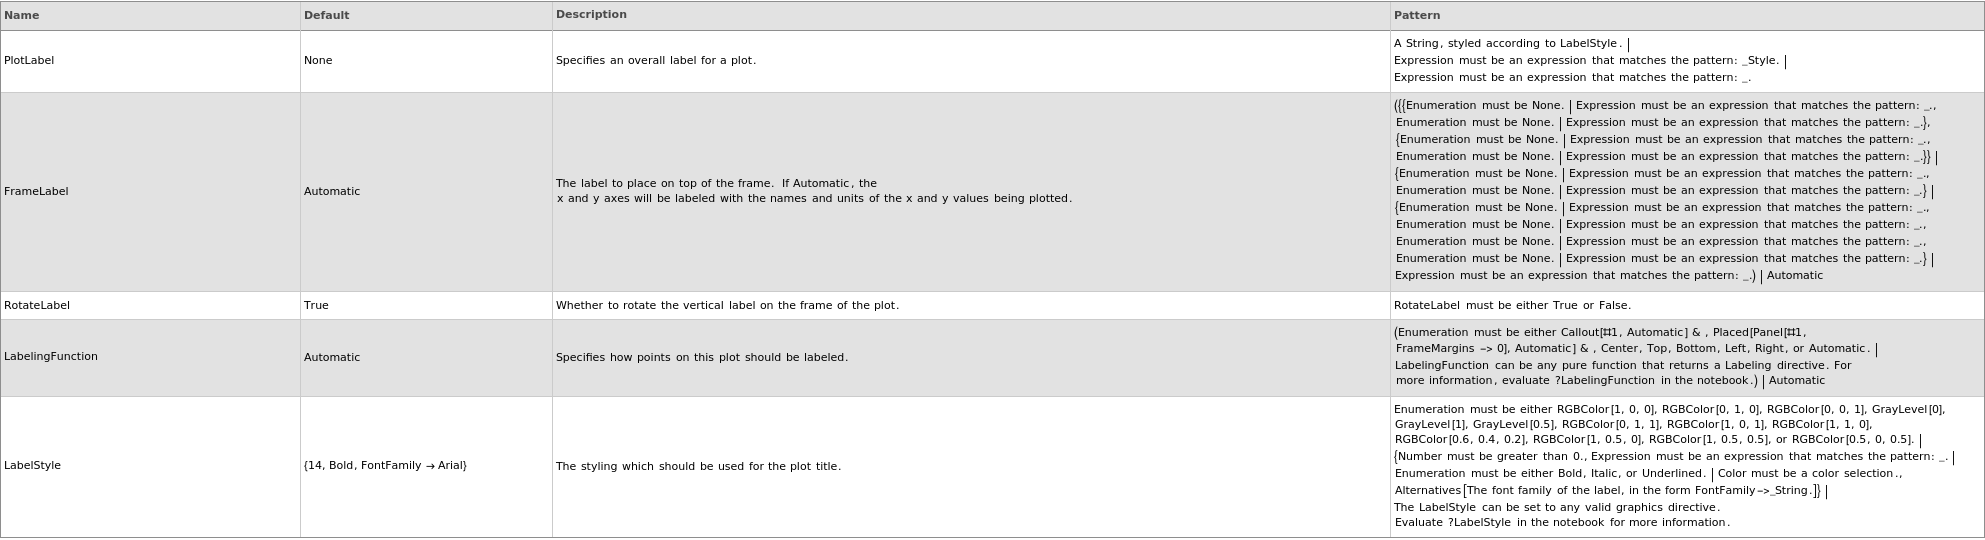
Plot Labeling Options
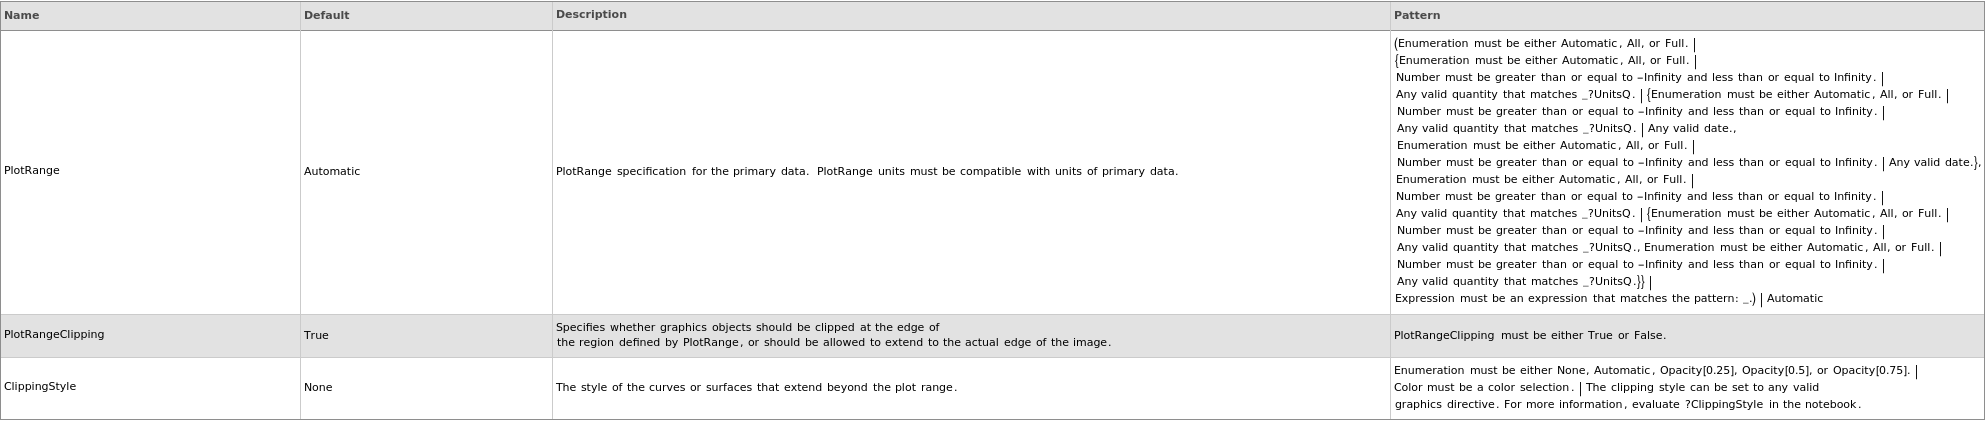
Plot Range Options
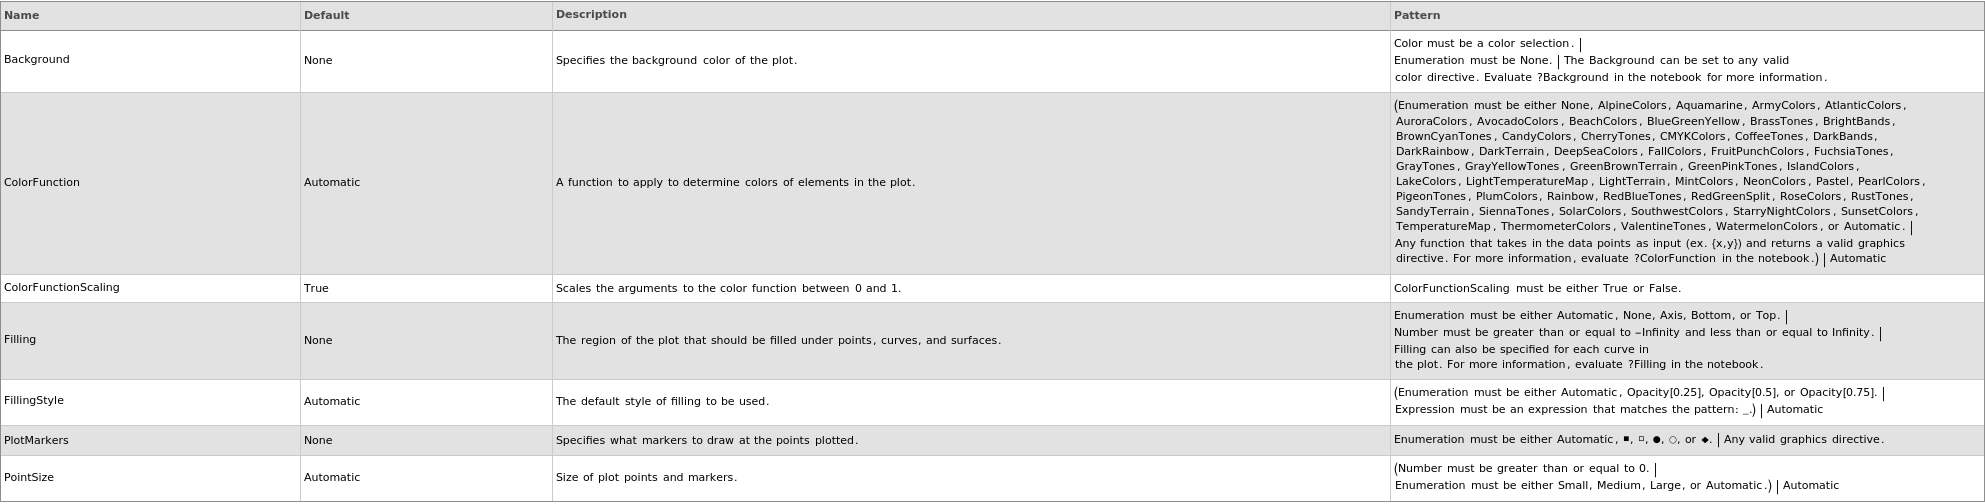
Plot Style Options
General Options

Examples
open allclose allBasic Examples (4)
Additional Examples (4)
Options (68)
ConfidenceLevel (2)
Display (5)
Error (3)
GridLines (1)
InterpolationOrder (1)
Joined (1)
PlotRange (1)
PlotRangeClipping (1)
PlotType (4)
PointSize (3)
SamplePoints (3)


Last modified on Wed 27 Aug 2025 17:20:49