PlotFluorescenceThermodynamics
PlotFluorescenceThermodynamics[FluorescenceThermodynamicsObject]⟹Plot
plots the cooling and melting curves contained by FluorescenceThermodynamicsObject.
PlotFluorescenceThermodynamics[Protocol]⟹Plot
creates a Plot of the cooling and melting curves found in the Data field of Protocol.
Details
Input

Output

Data Specifications Options

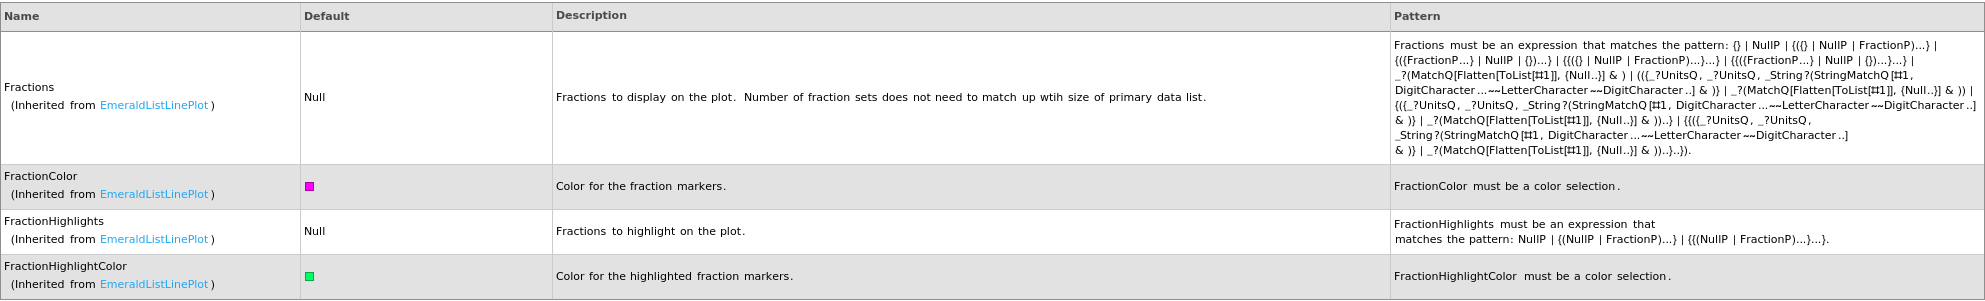
Fractions Options
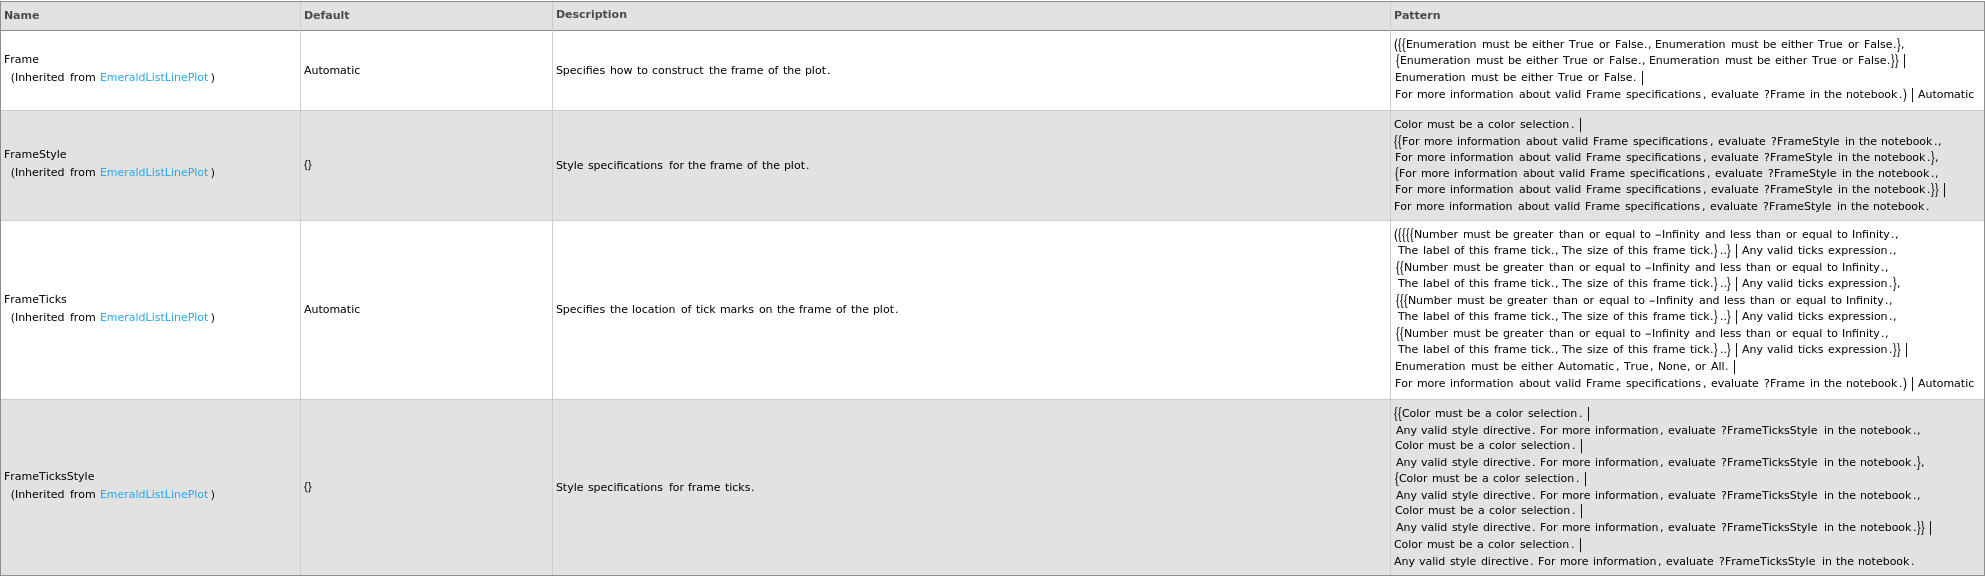
Frame Options
Grid Options
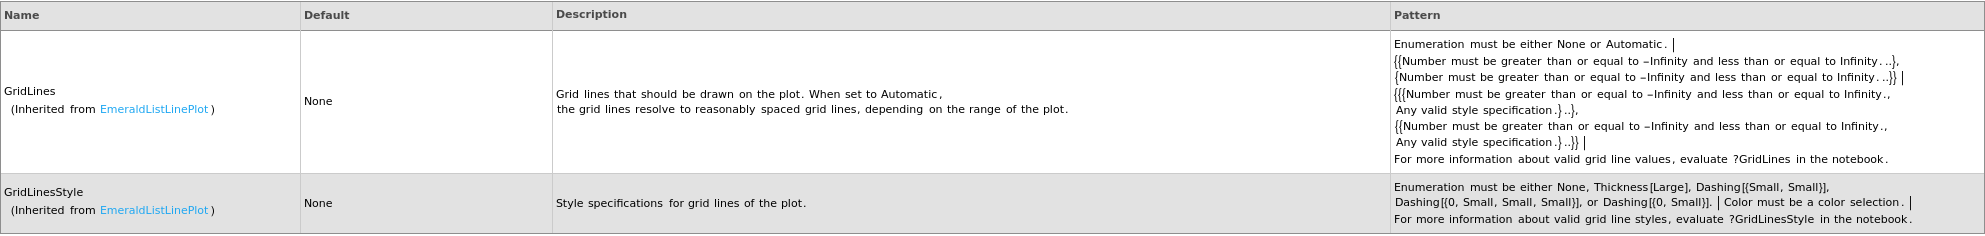
Image Format Options

Ladder Options

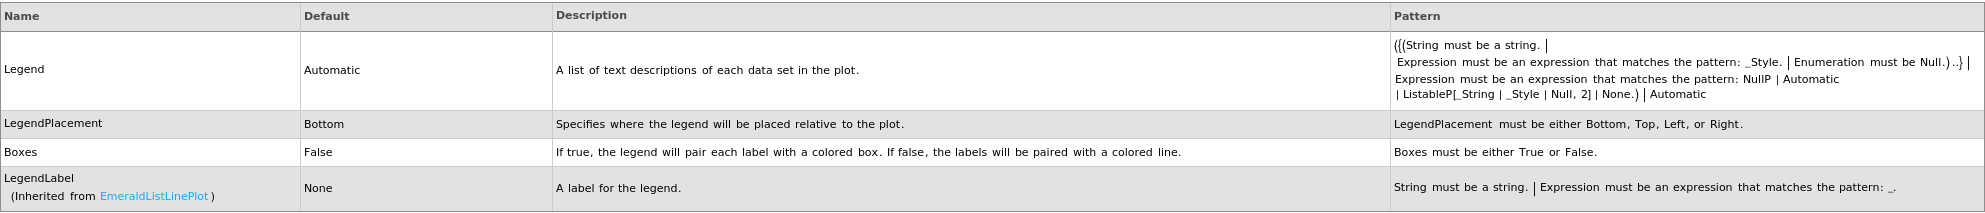
Legend Options
Peaks Options

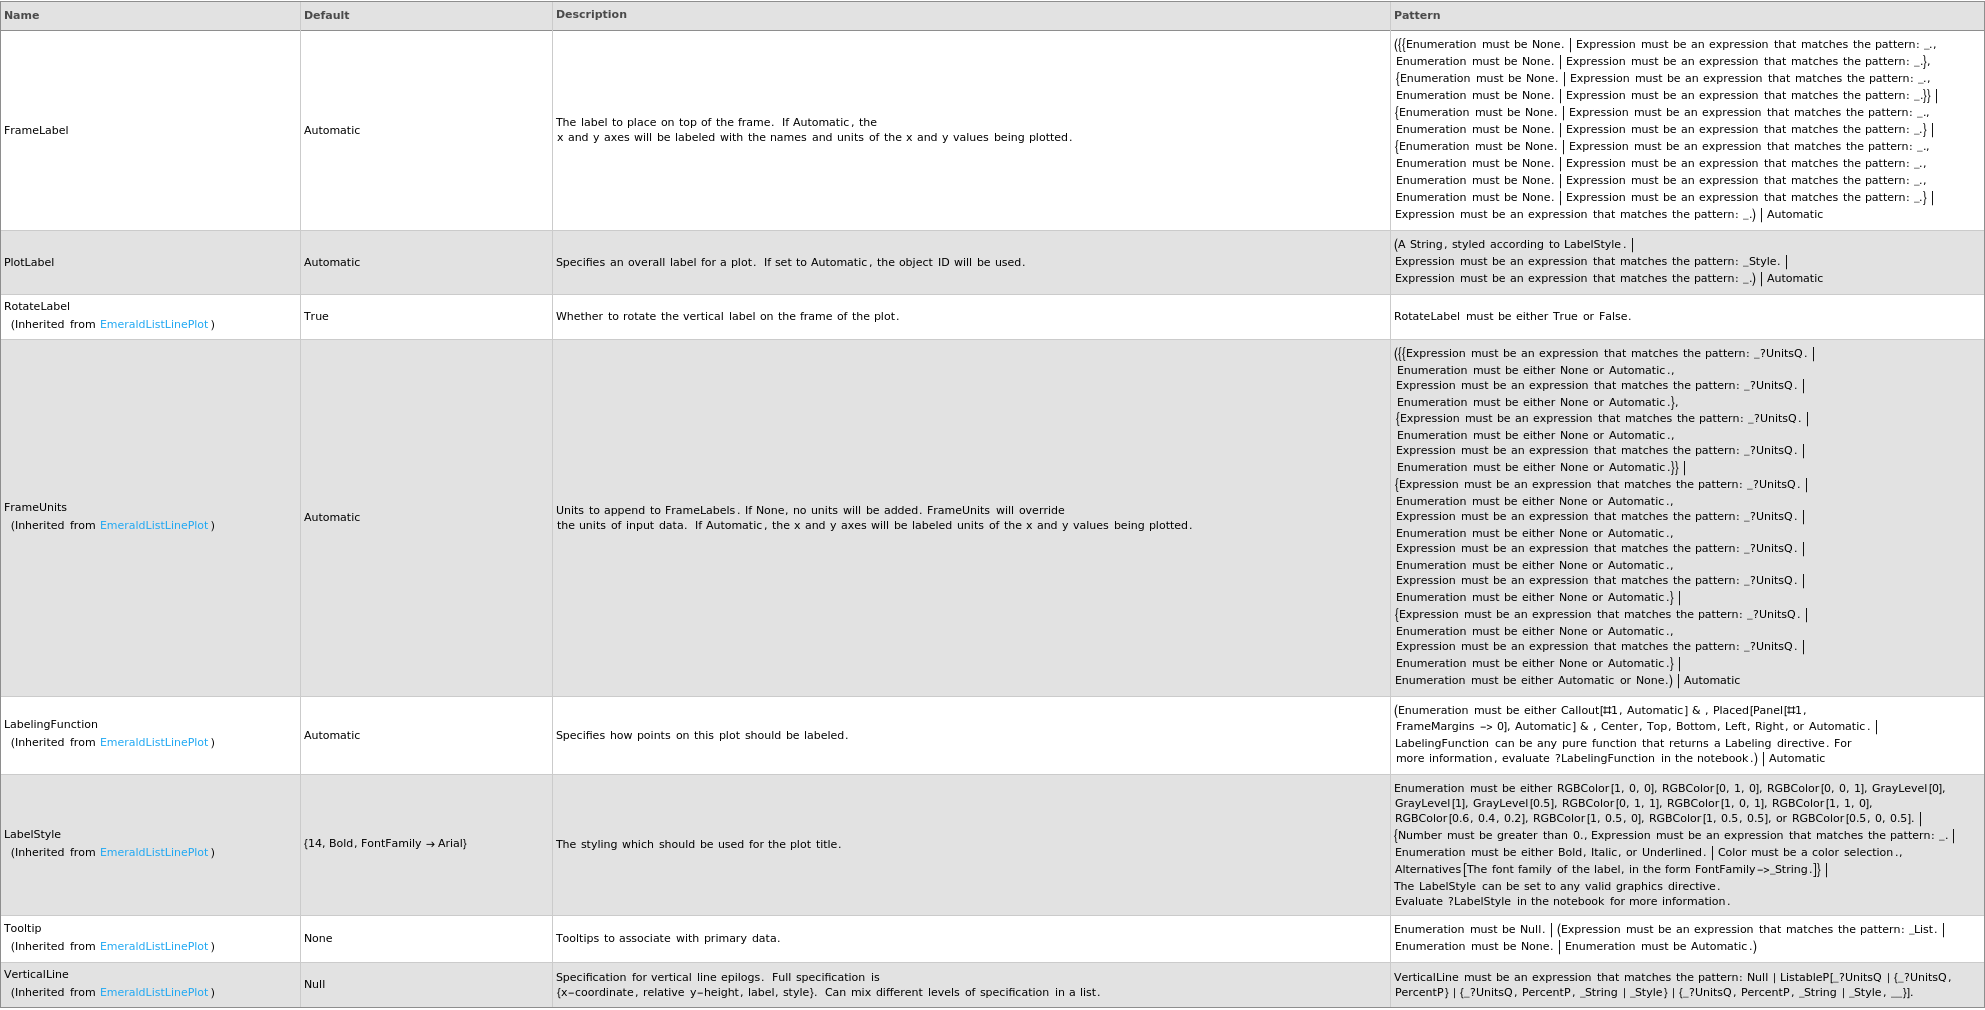
Plot Labeling Options
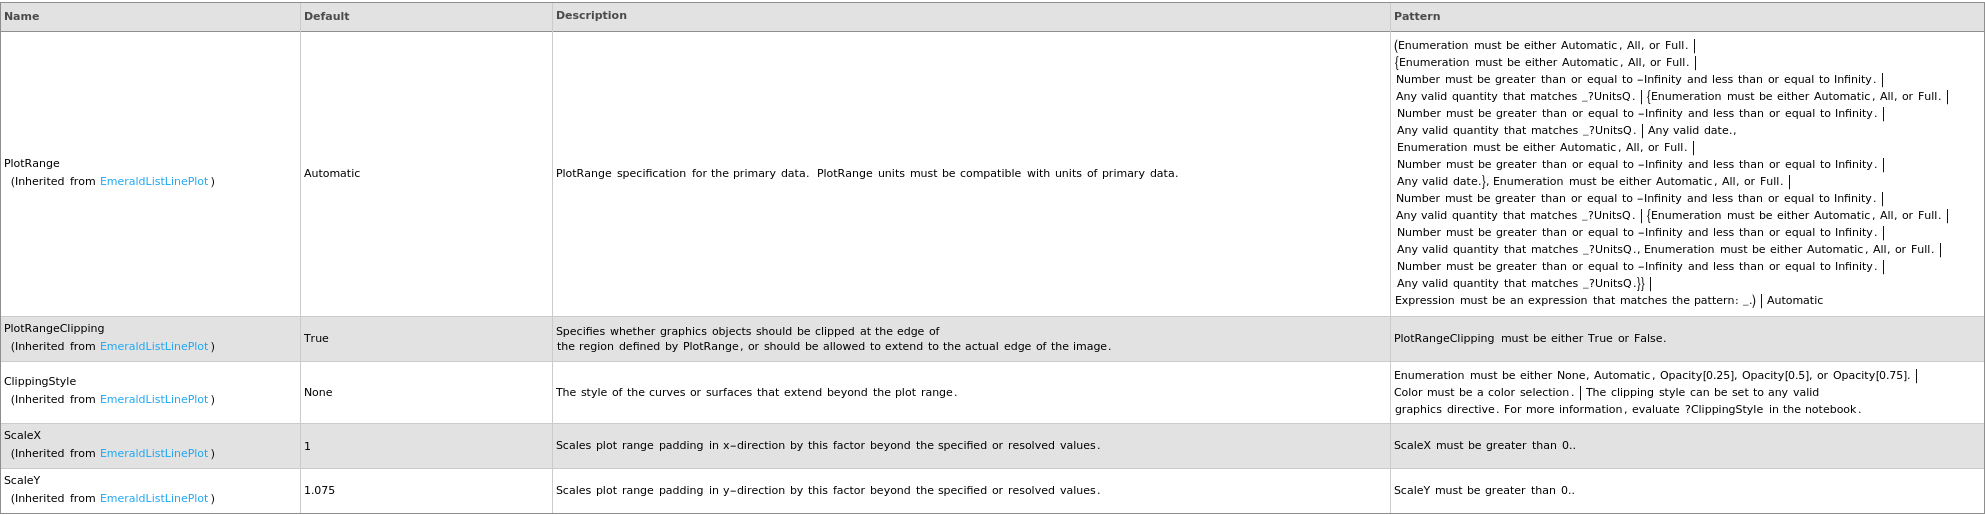
Plot Range Options
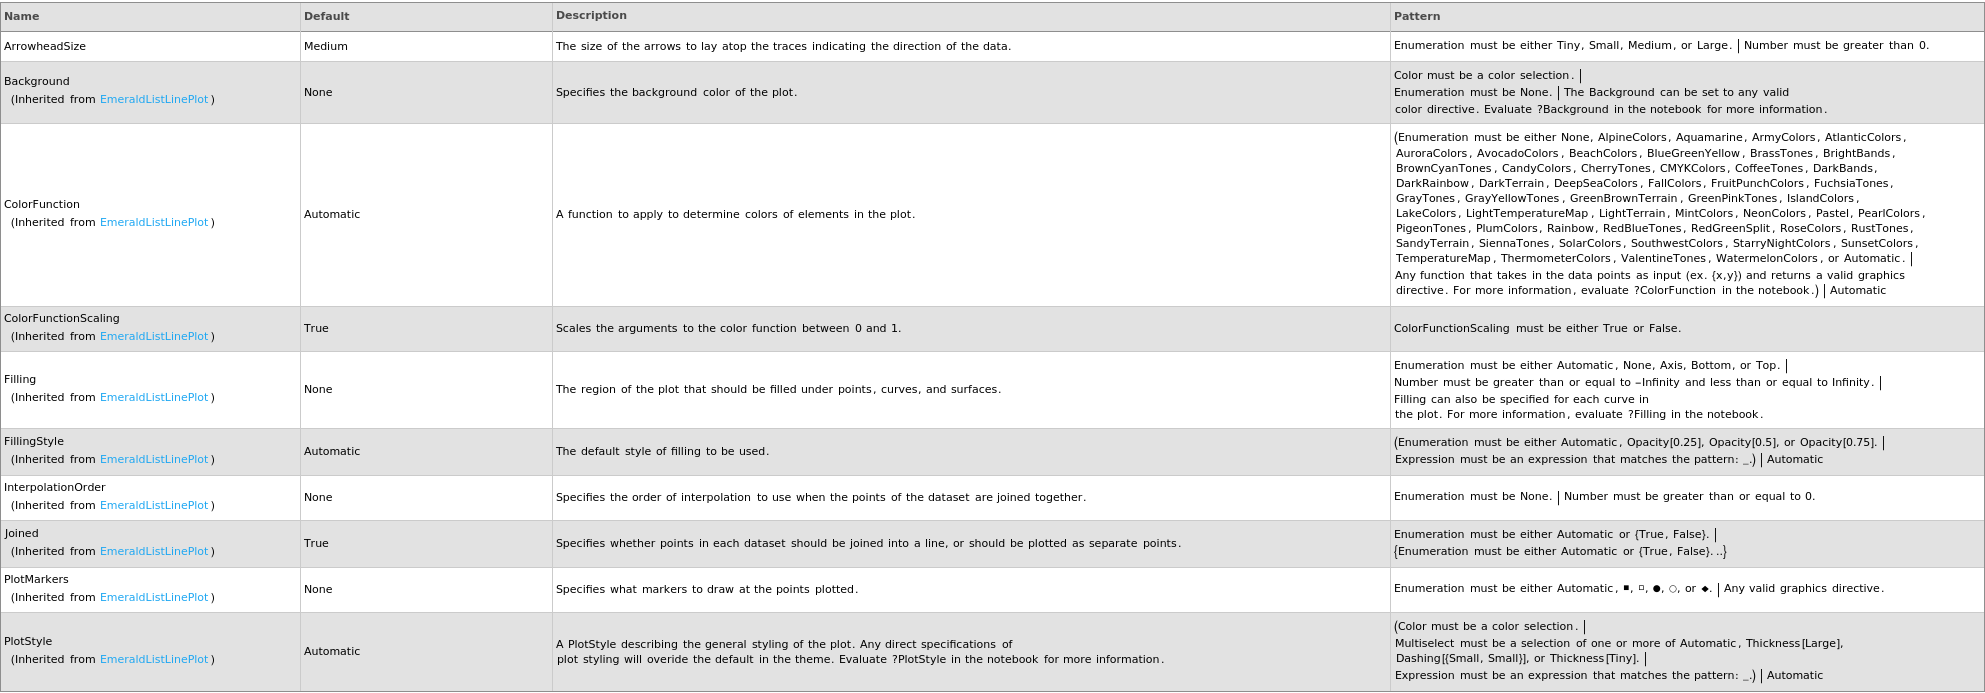
Plot Style Options
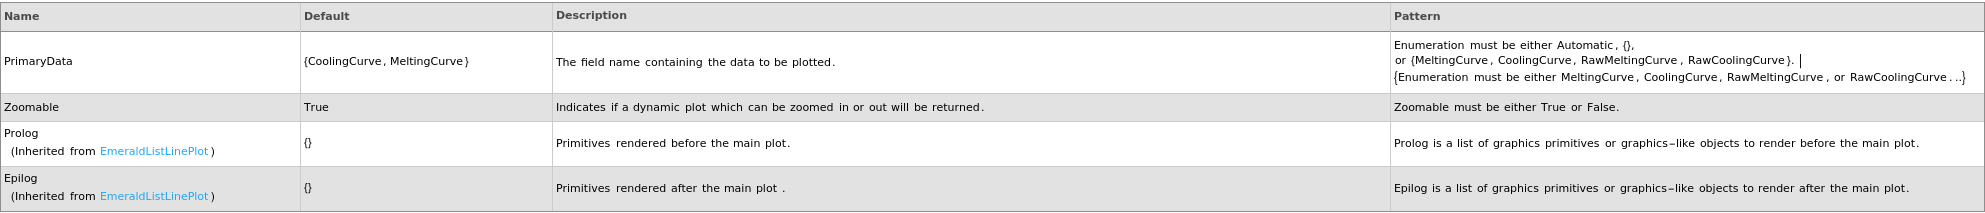
General Options
Examples
open allclose allBasic Examples (3)
Options (14)
IncludeReplicates (2)
Last modified on Wed 27 Aug 2025 17:21:30