PlotGradient
PlotGradient[GradientObject]⟹Plot
plots the buffer compositions as a function of time for a GradientObject.
Details
Input

Output

Data Specifications Options
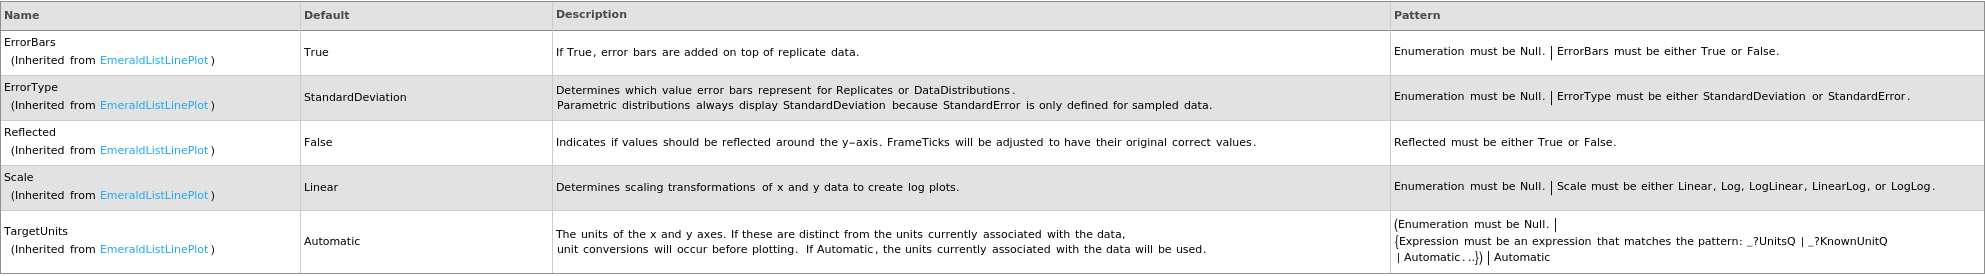
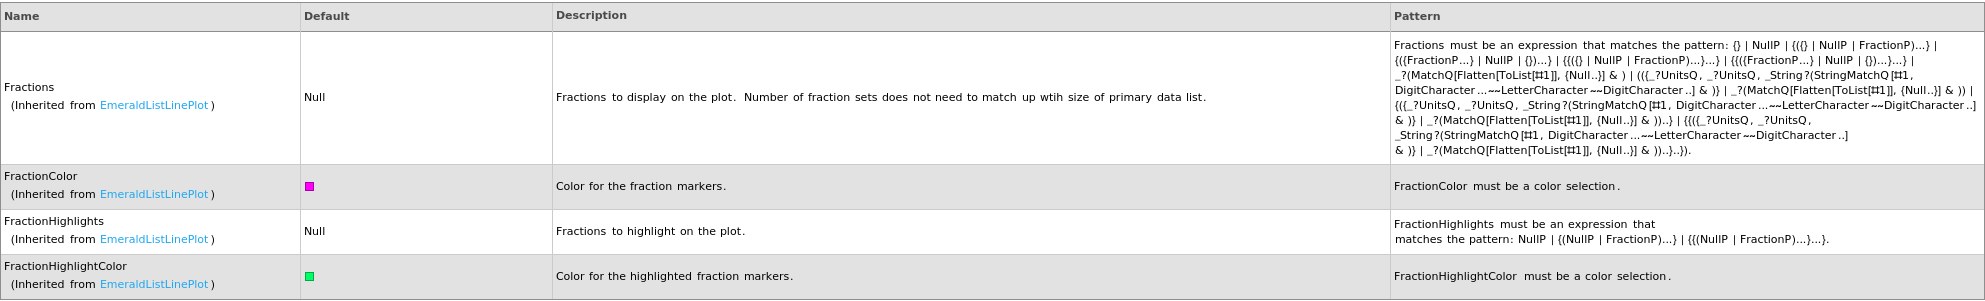
Fractions Options
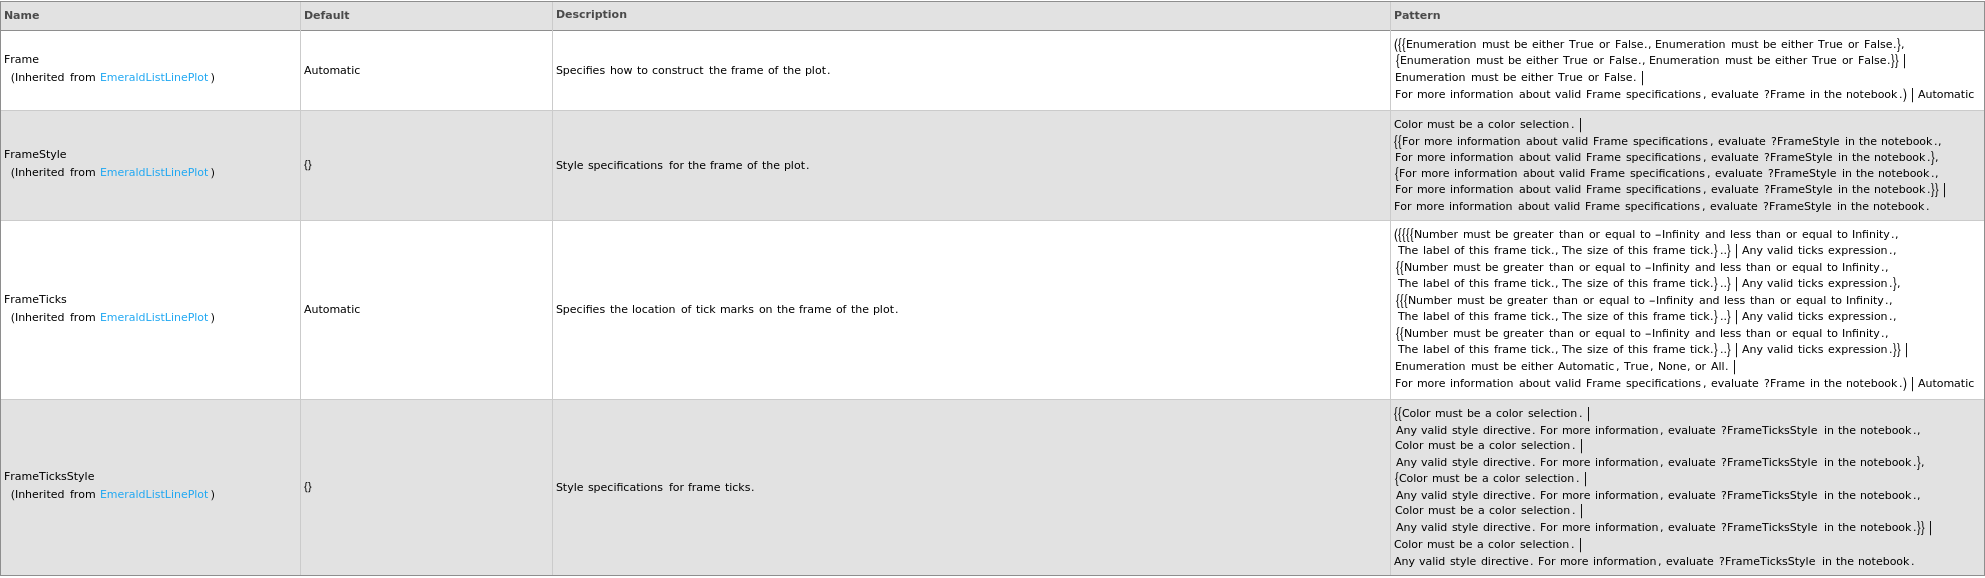
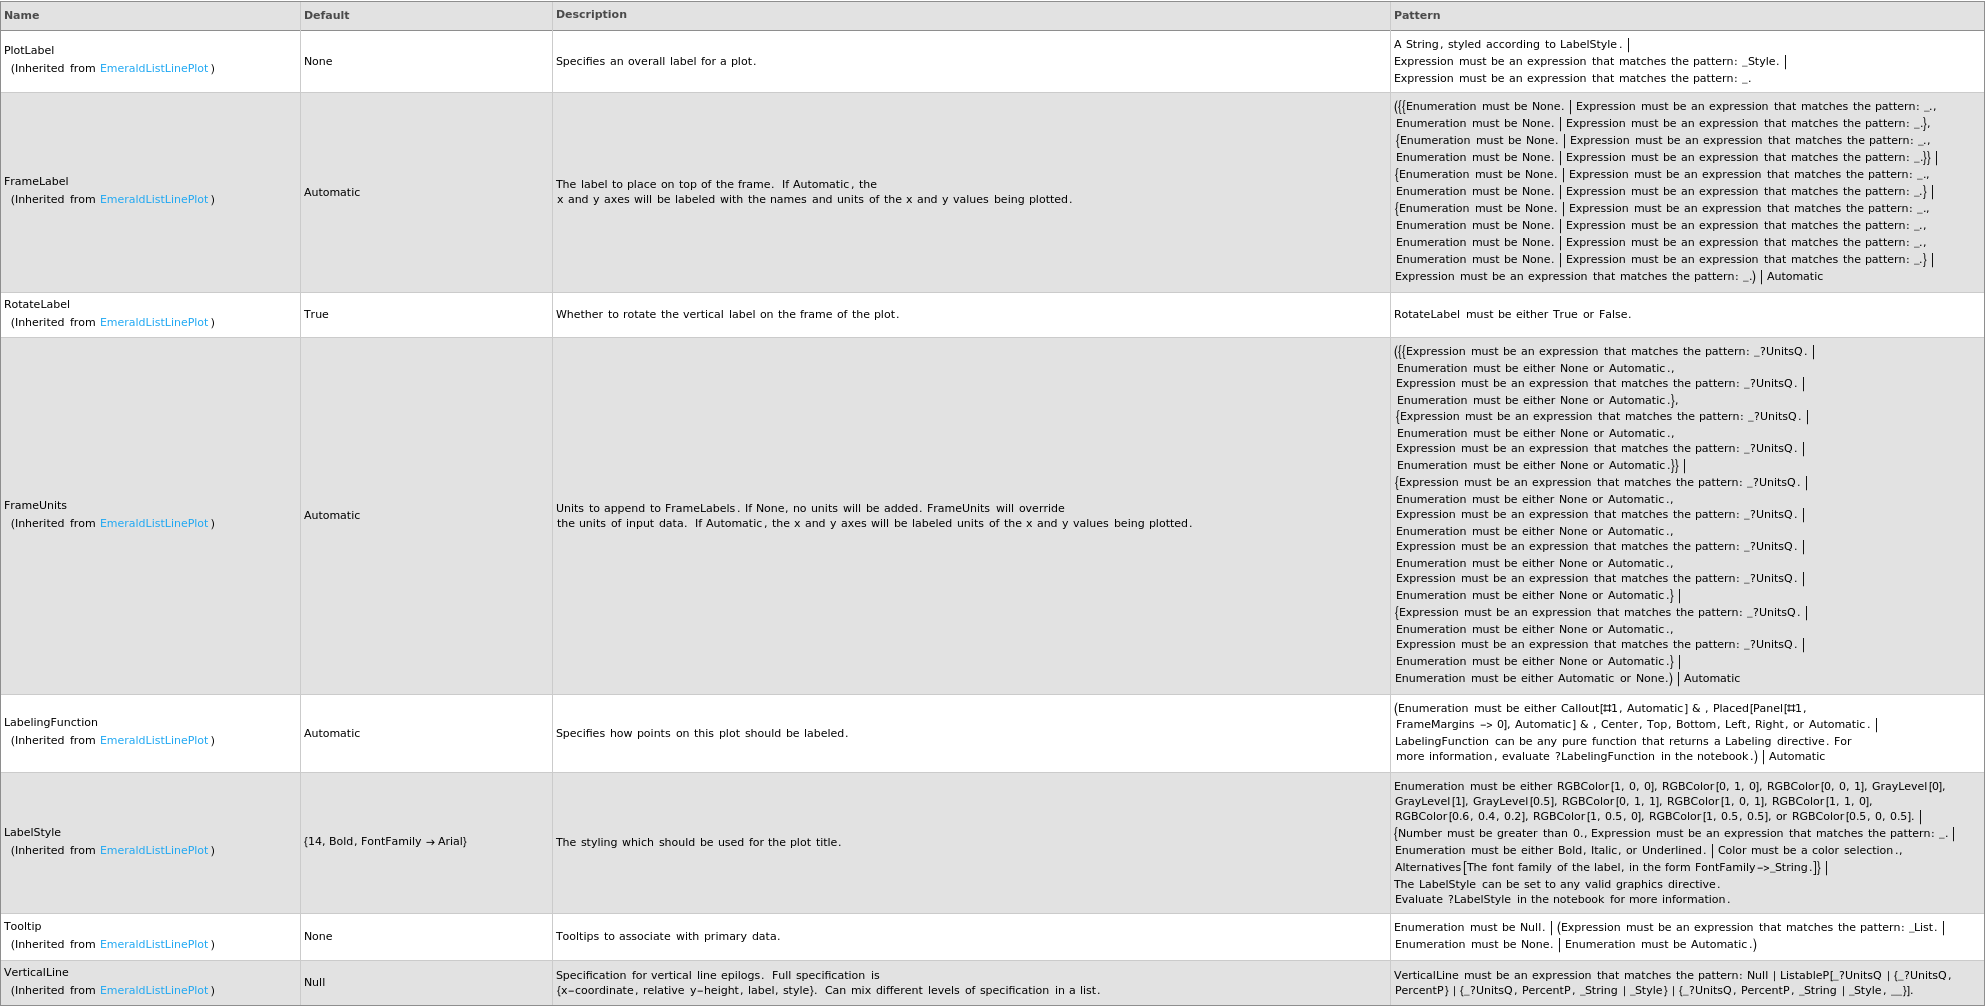
Frame Options
Gradient Options

Grid Options
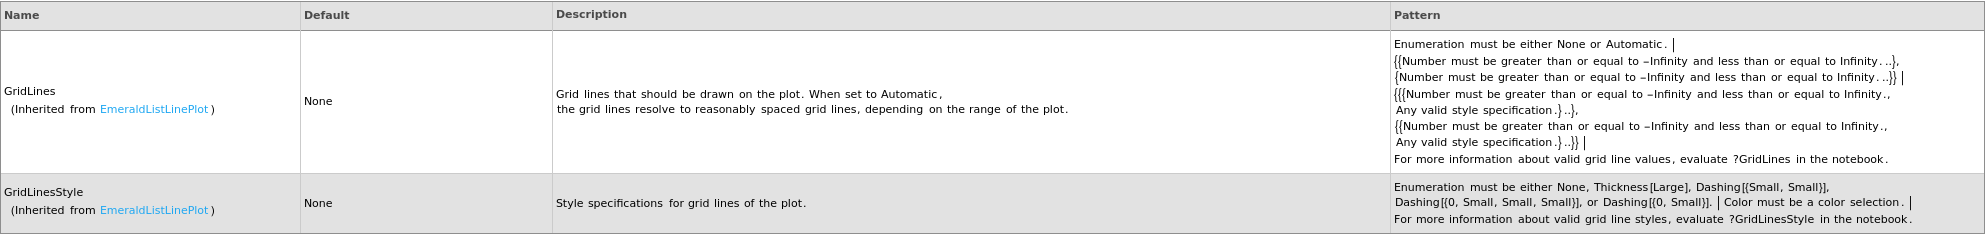
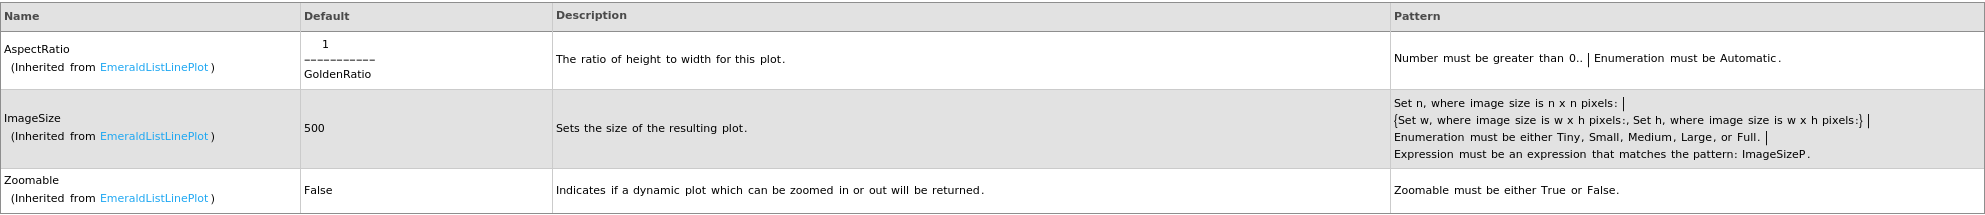
Image Format Options
Ladder Options

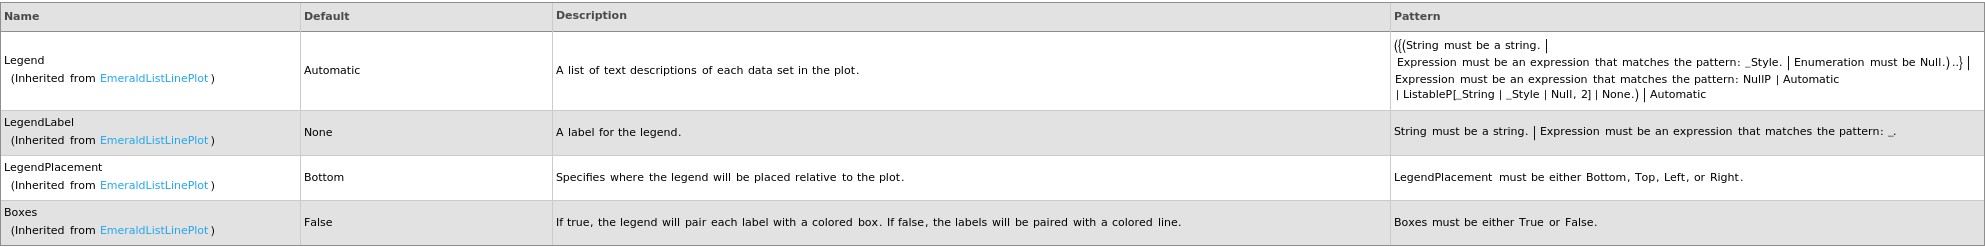
Legend Options
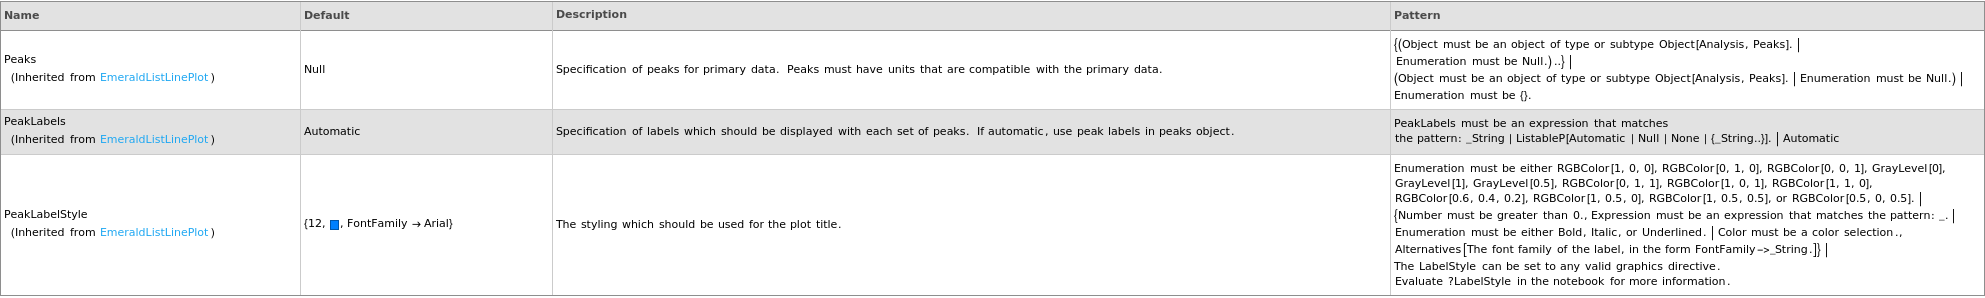
Peaks Options
Plot Labeling Options
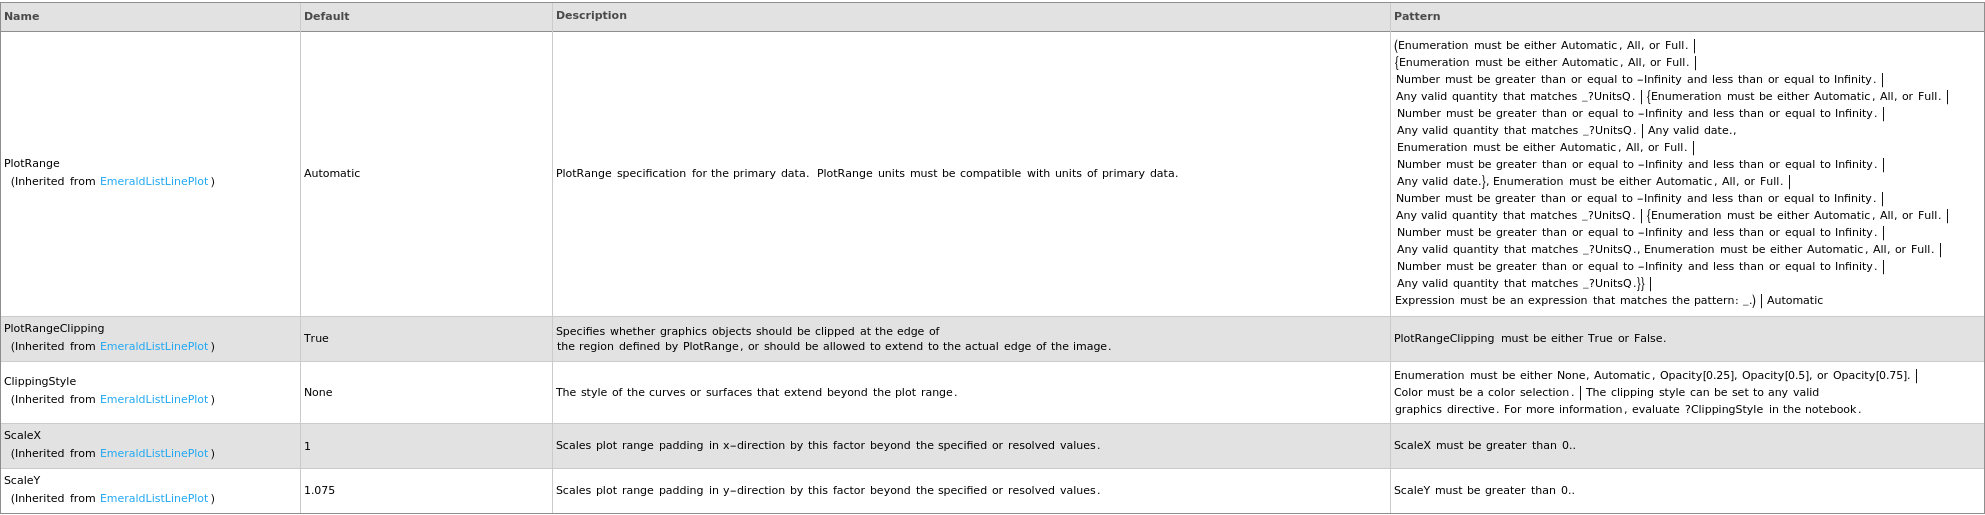
Plot Range Options
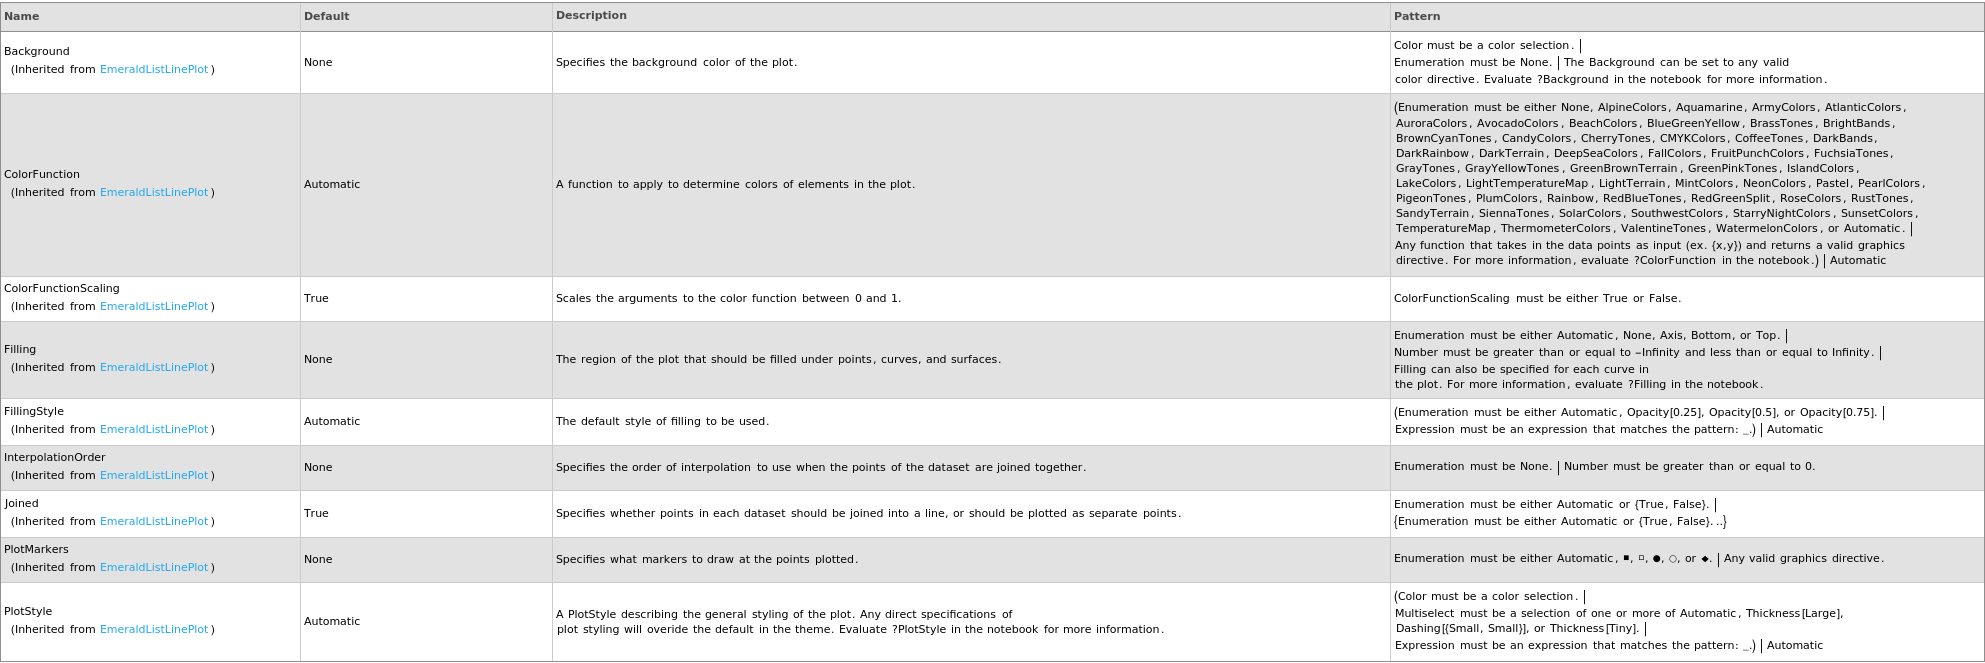
Plot Style Options
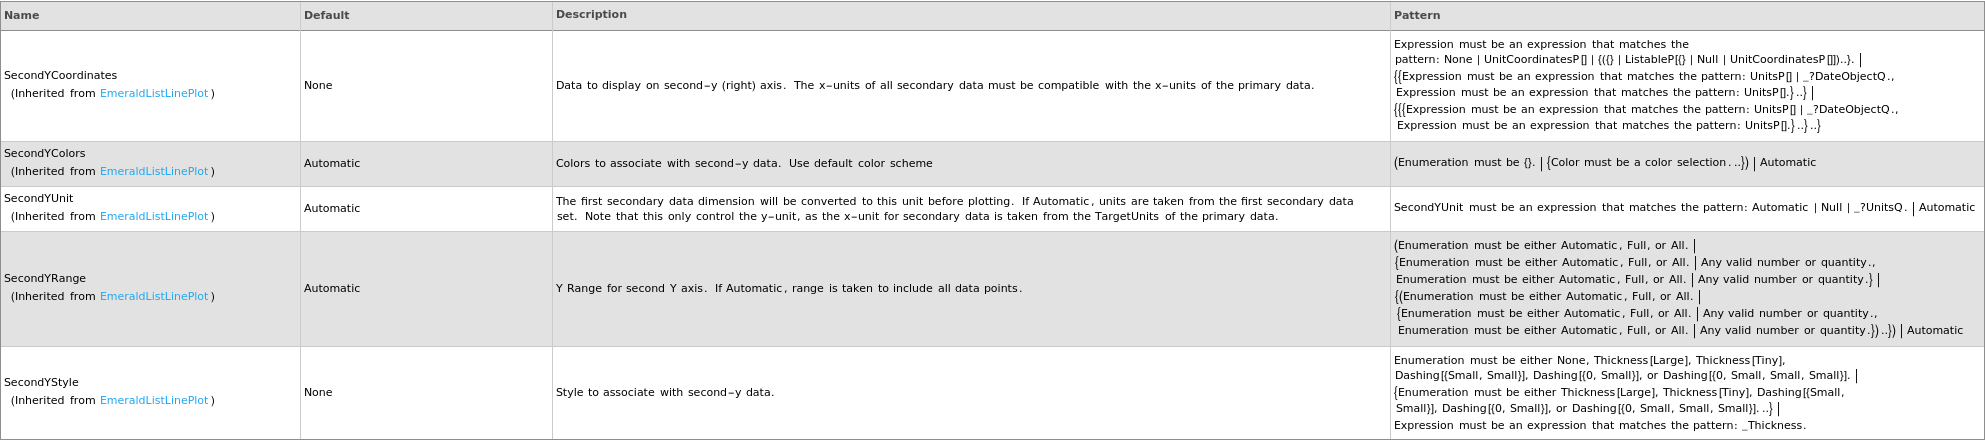
Secondary Data Options
General Options

Examples
open allclose allBasic Examples (7)
Options (9)
Buffers (7)
A warning is given when a Buffer/Eluent is selected that is not a part of the given Gradient:

A warning is given when a Buffer/Eluent is selected that is not a part of the given Ion Chromatography Gradient:

A warning is given when none of the Buffers/Eluents selected are part of the given Gradient:

Plot only data for BufferB and BufferC:
Last modified on Fri 19 Sep 2025 08:47:32