PlotLuminescenceSpectroscopy
PlotLuminescenceSpectroscopy[LuminescenceSpectroscopyData]⟹Plot
displays luminescence intensity vs wavelength for the supplied LuminescenceSpectroscopyData.
PlotLuminescenceSpectroscopy[Protocol]⟹Plot
creates a Plot of luminescence intensity vs wavelength for the data found in the Data field of Protocol.
Details
Input

Output

Data Specifications Options

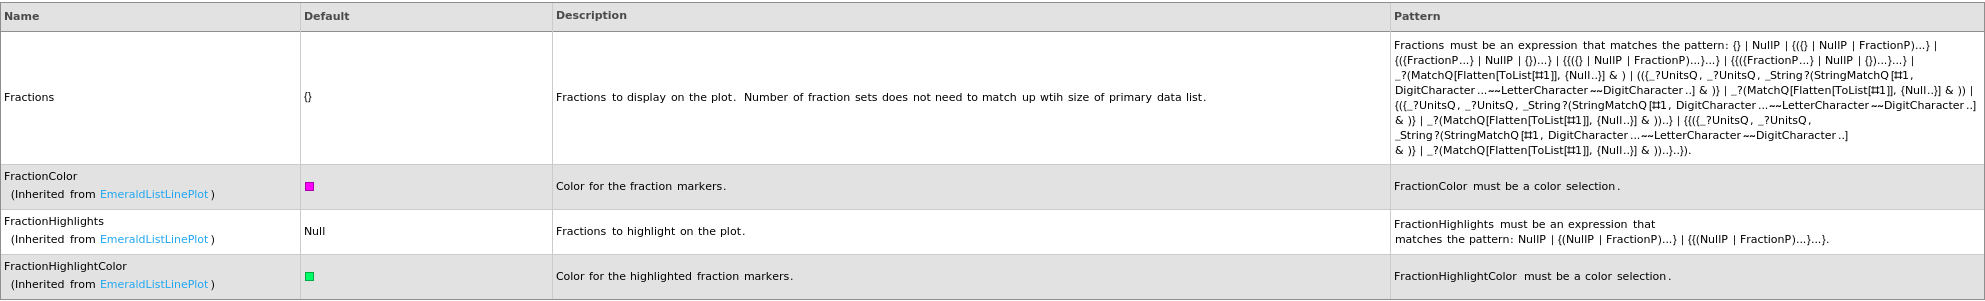
Fractions Options
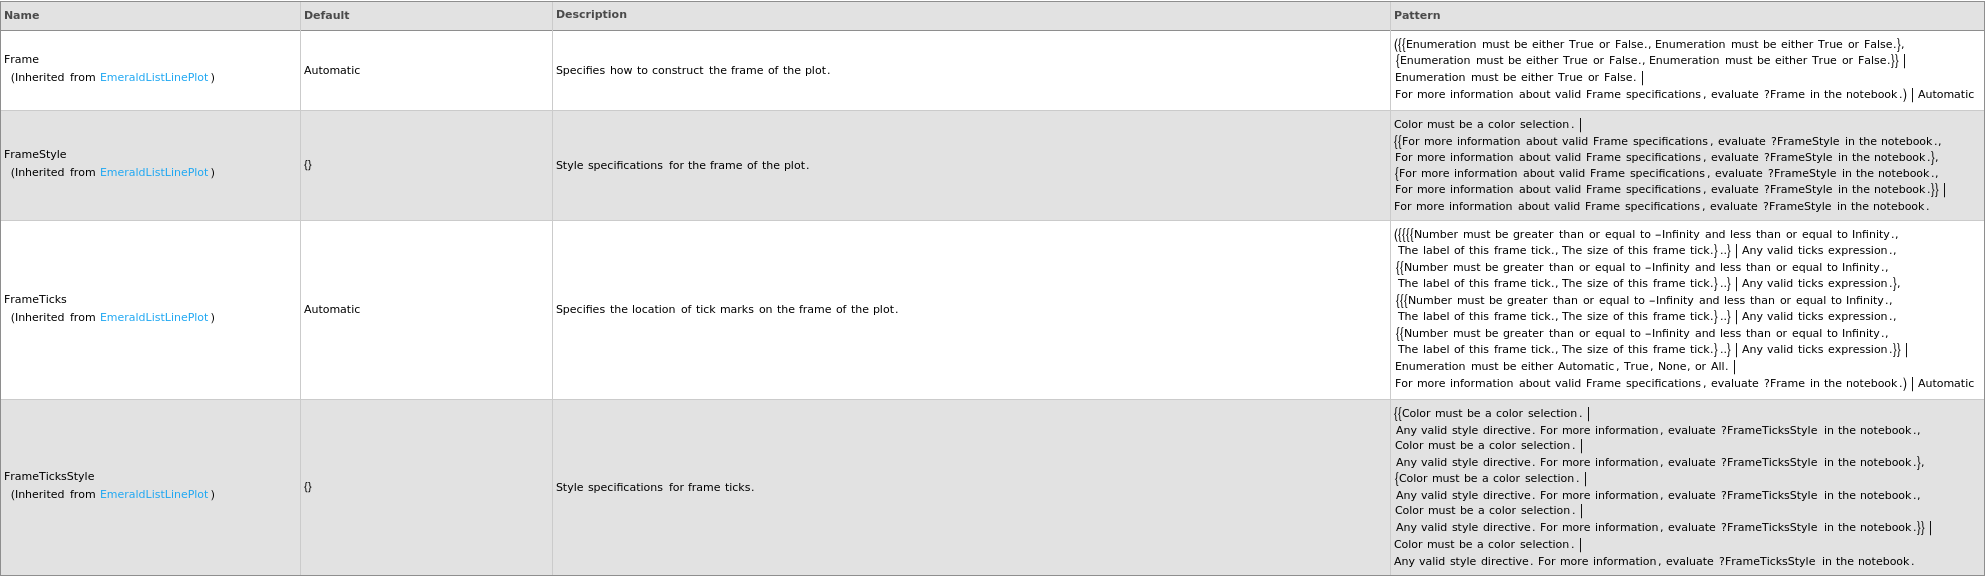
Frame Options
Grid Options
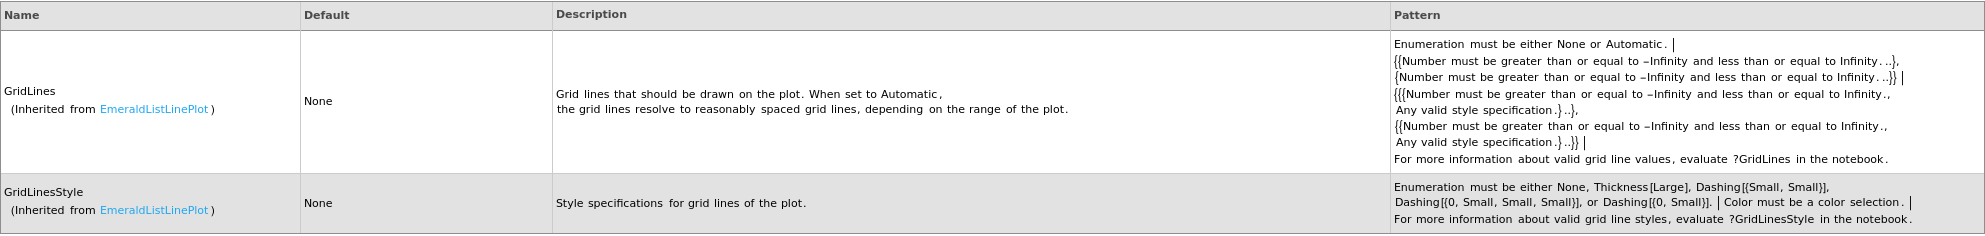
Image Format Options

Ladder Options

Legend Options

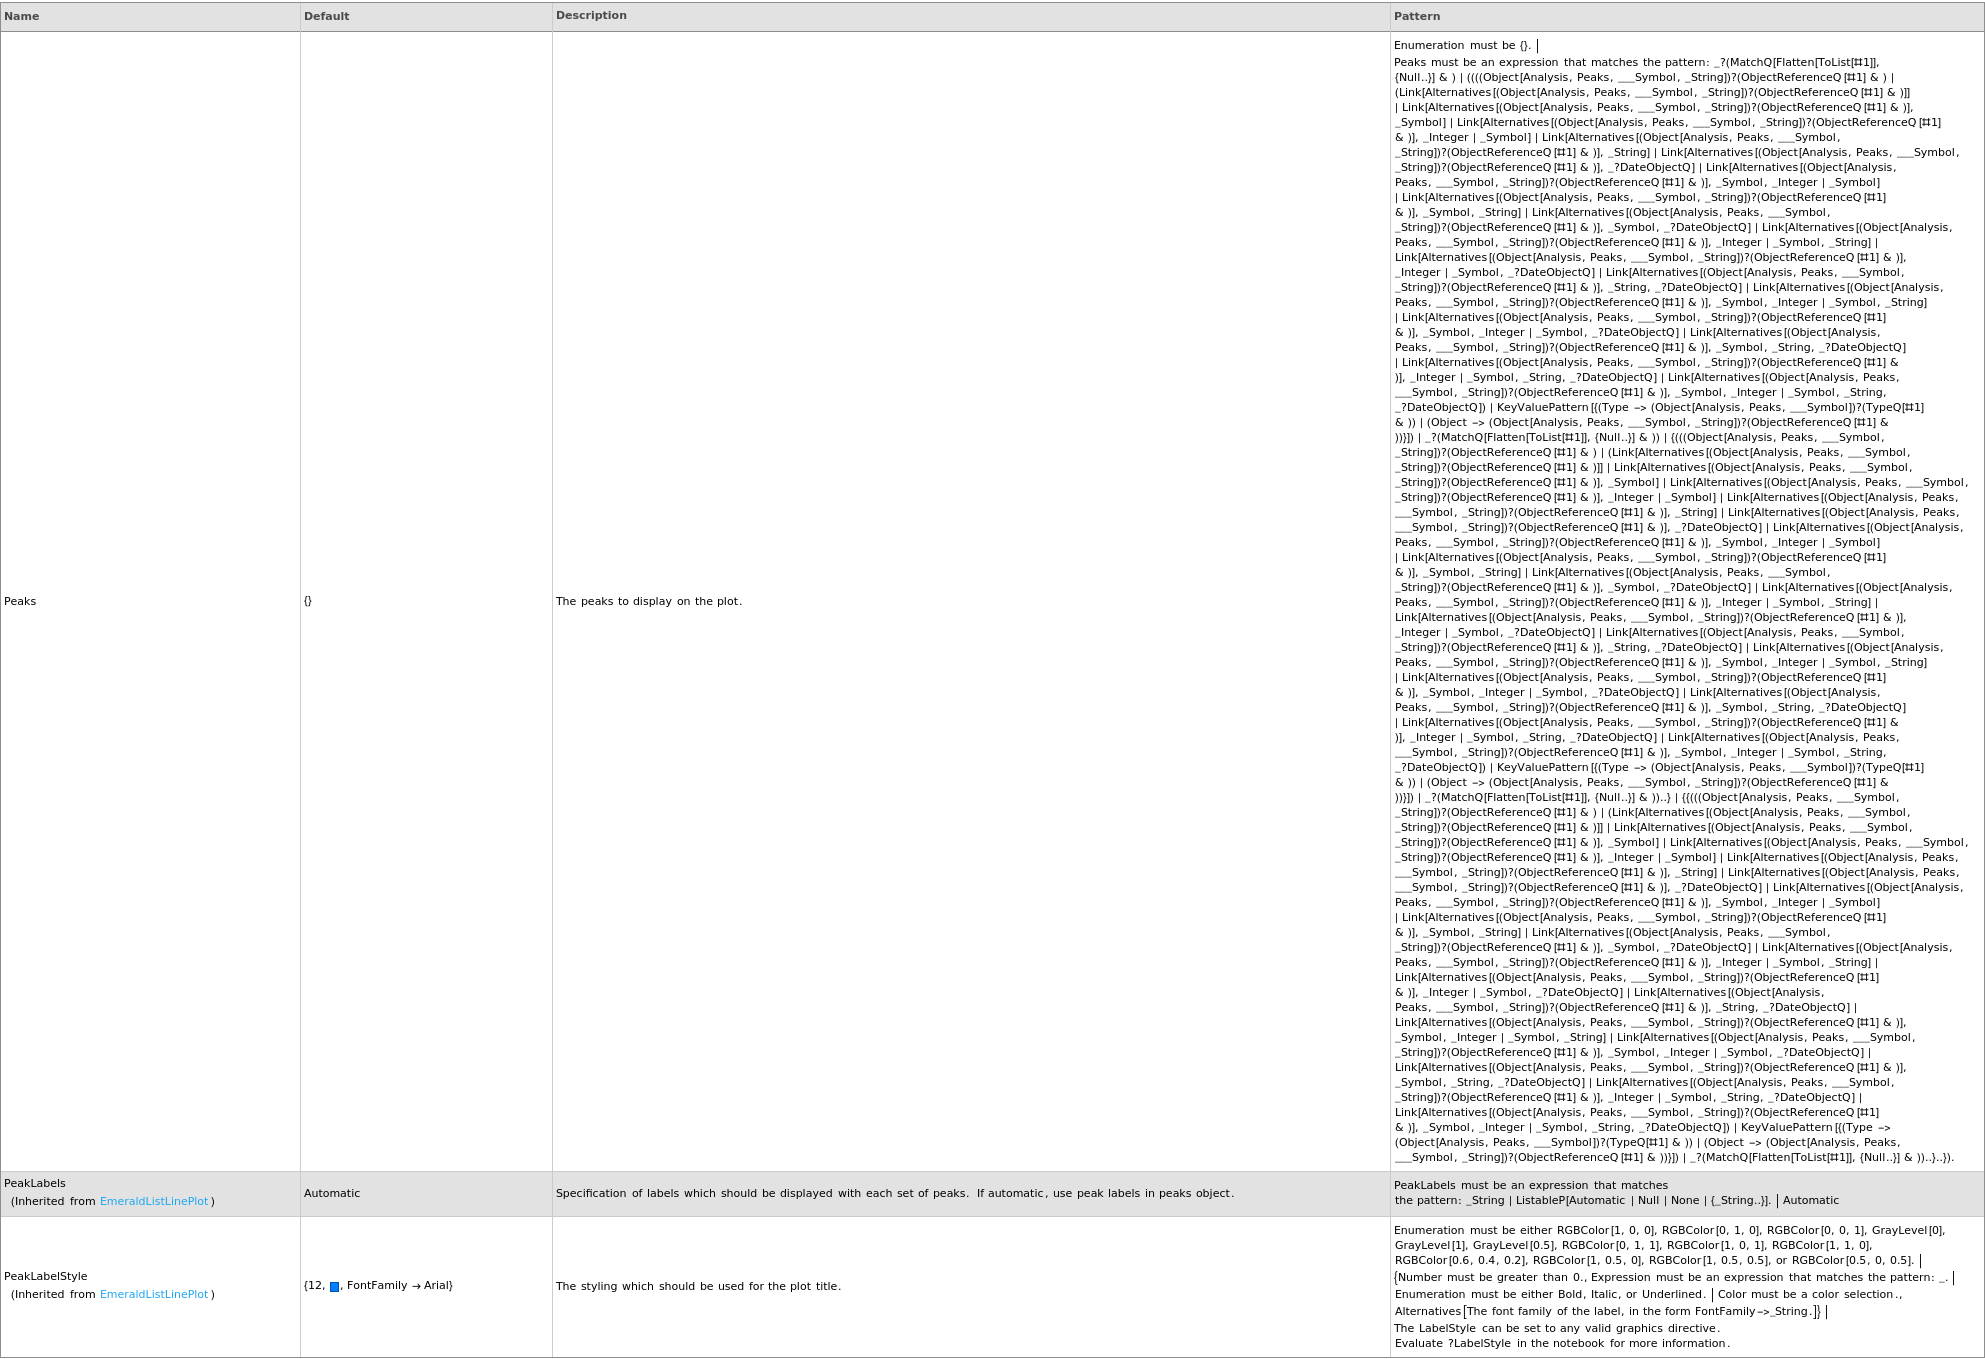
Peaks Options
Plot Labeling Options
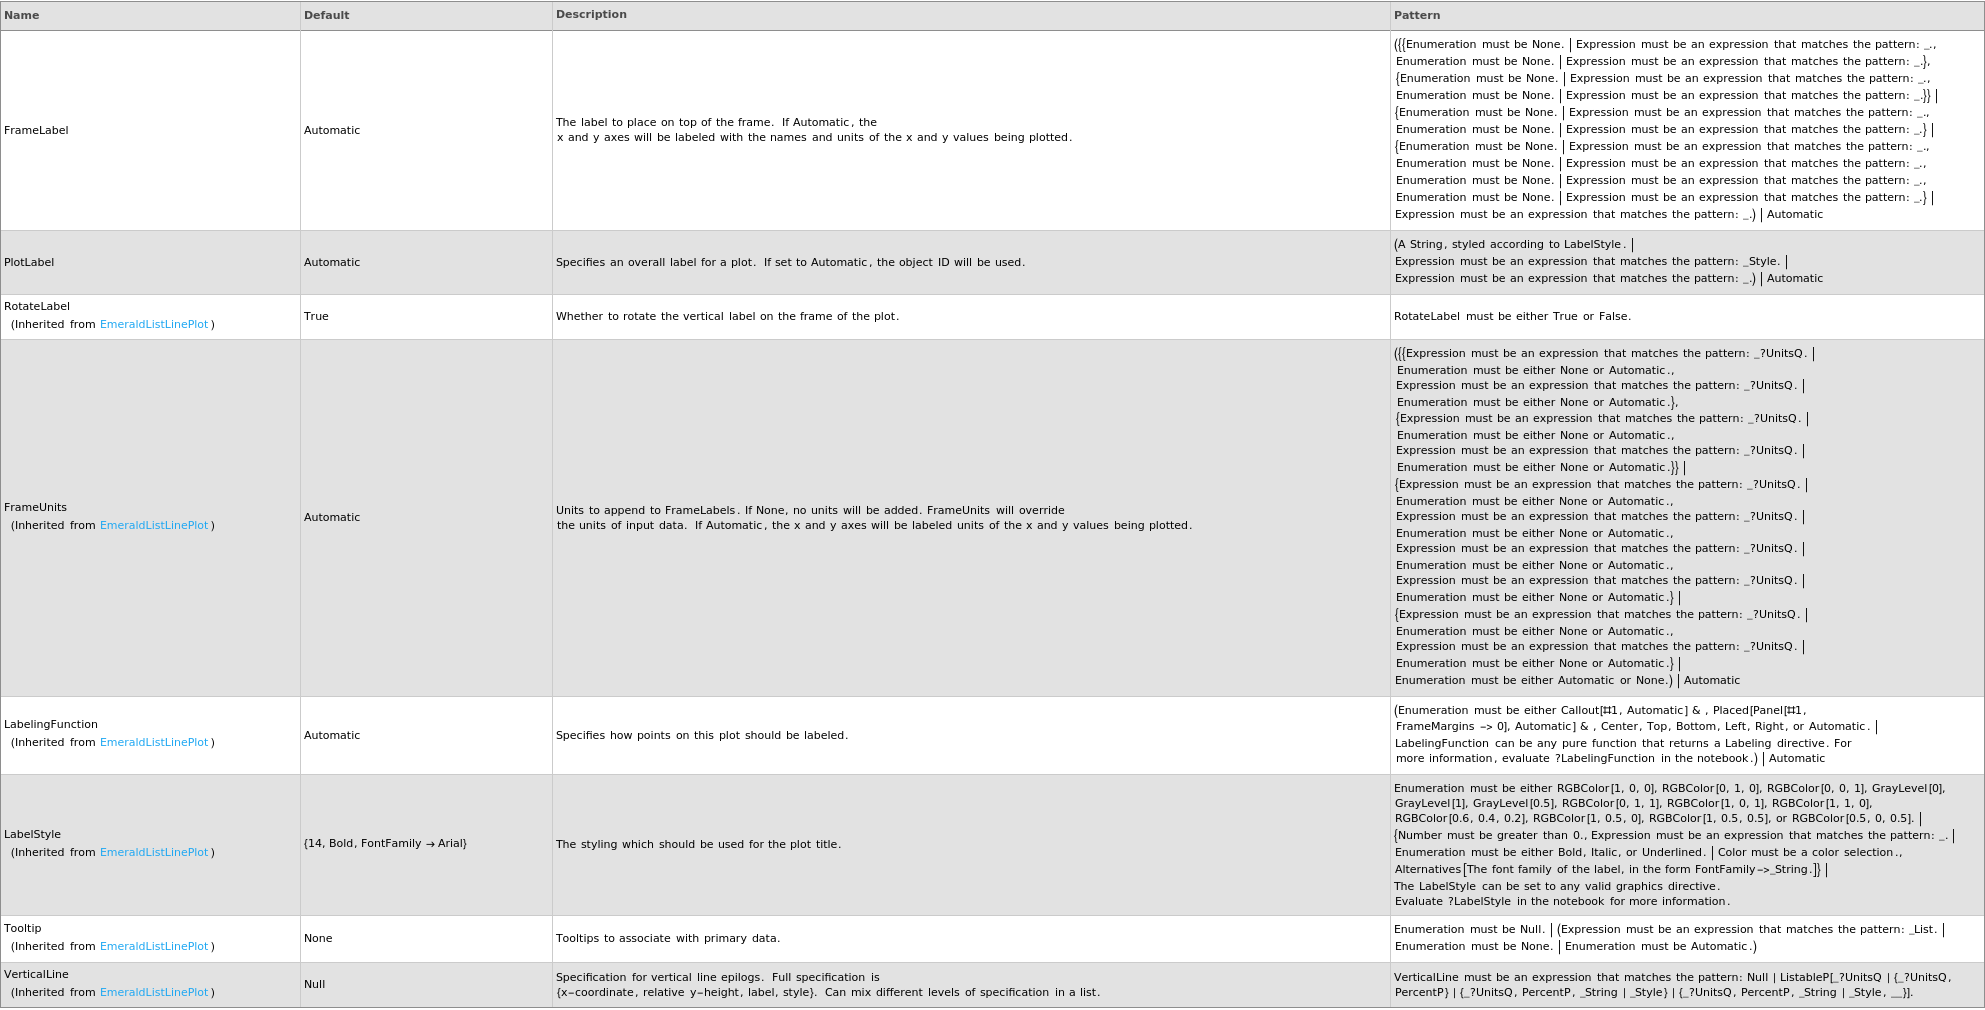
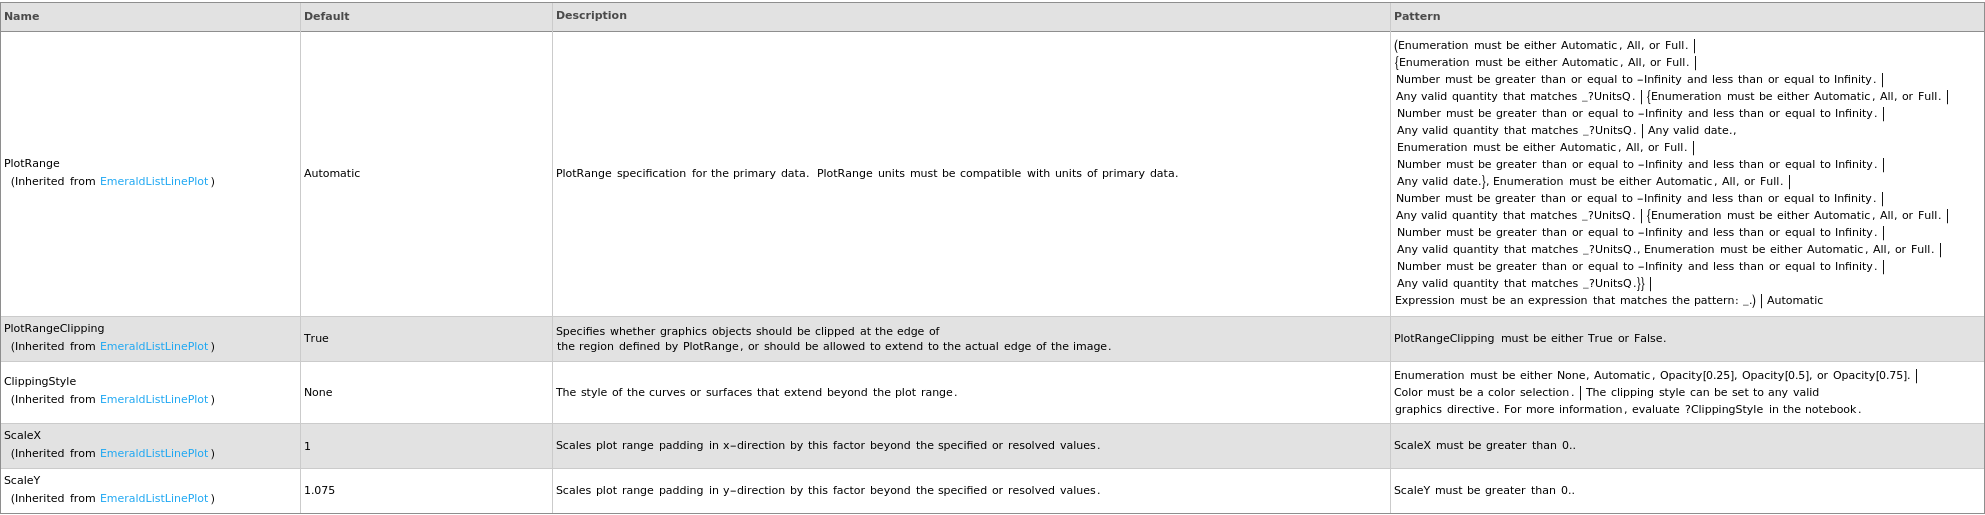
Plot Range Options
Plot Style Options
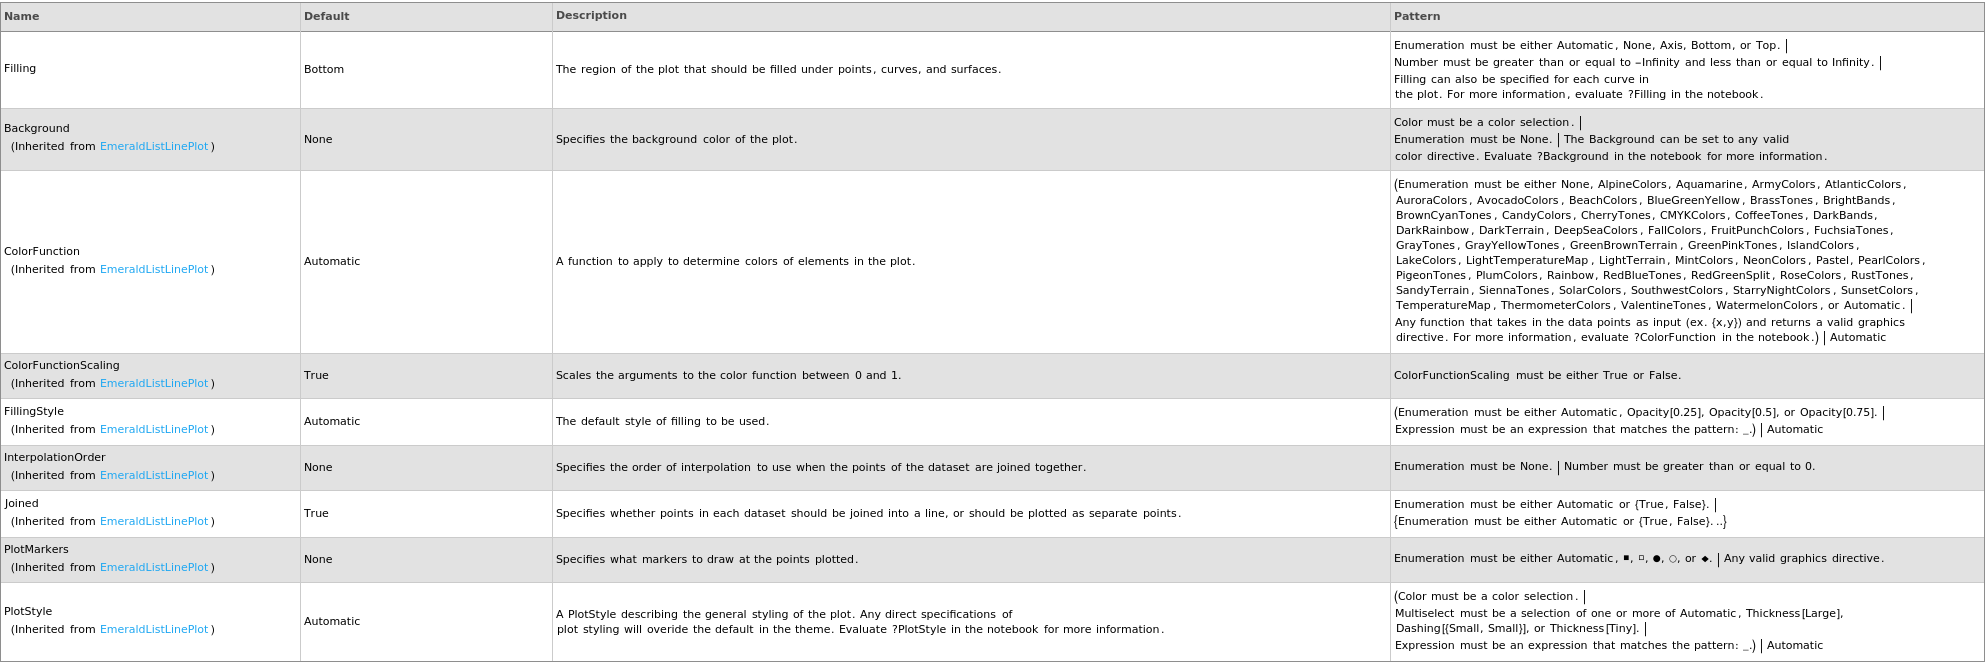
General Options

Examples
open allclose allBasic Examples (3)
Options (20)
Boxes (1)
EmissionSpectrum (1)
IncludeReplicates (1)
PlotTheme (1)
Last modified on Fri 19 Sep 2025 08:49:16