PlotProbeConcentration
PlotProbeConcentration[ProbeSimulation]⟹Plot
plots probe accessibility along the target sequence in the provided ProbeSimulation object.
Details
Input

Output

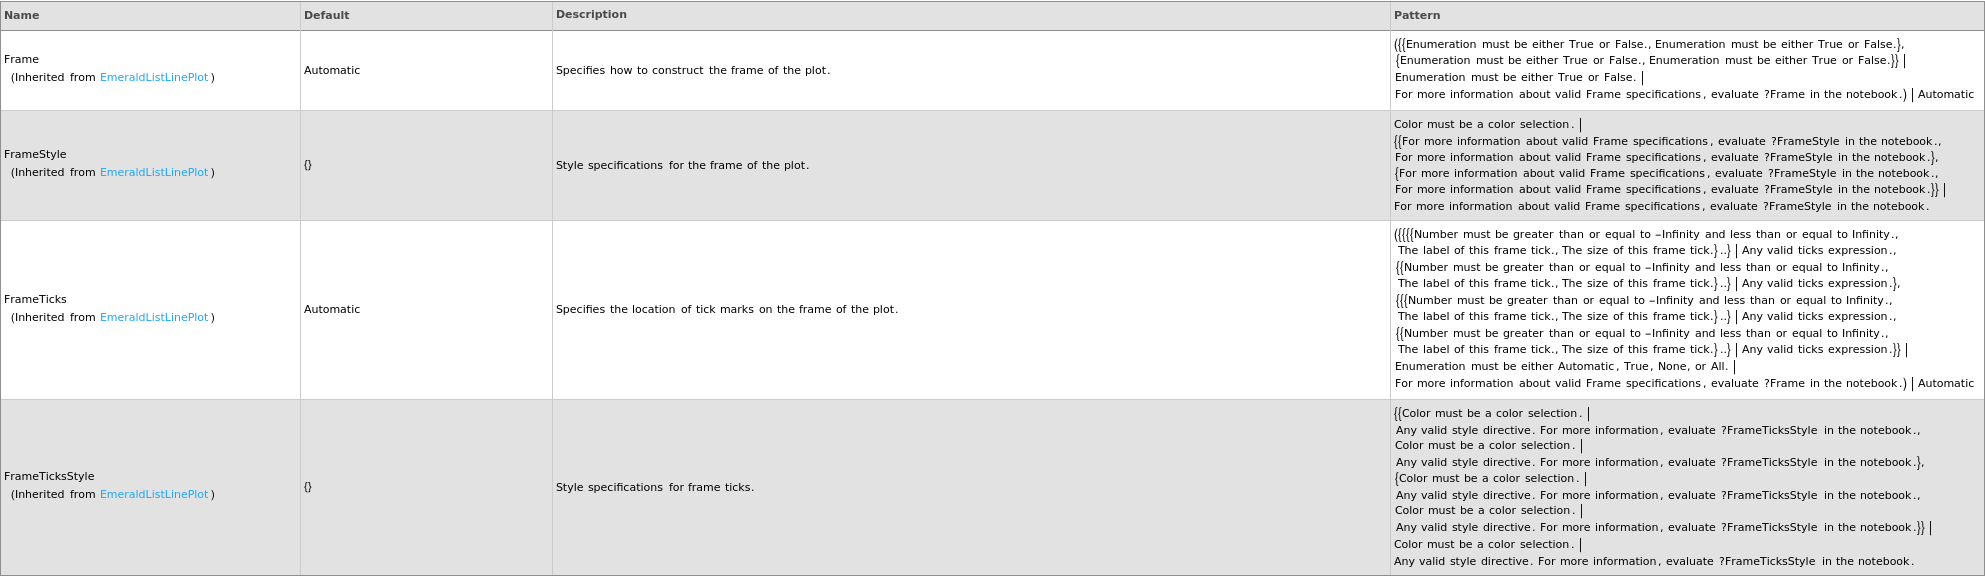
Frame Options
Grid Options
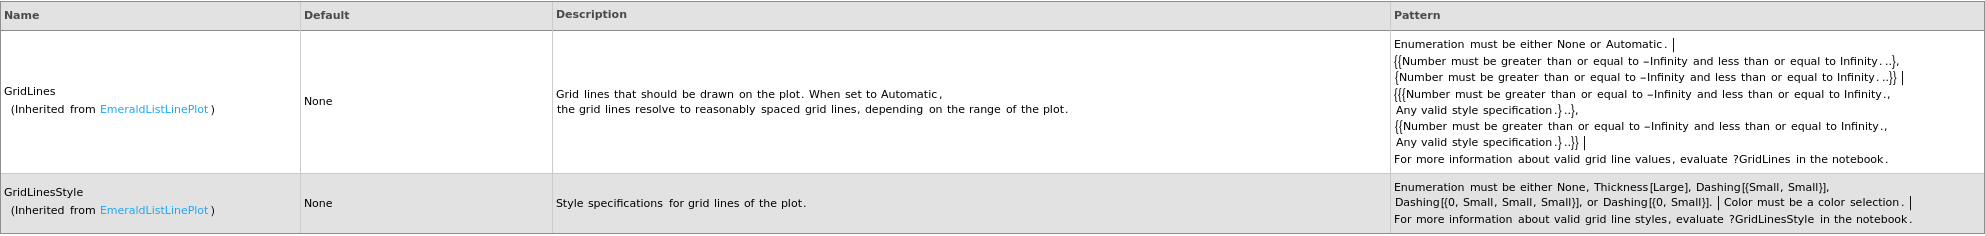
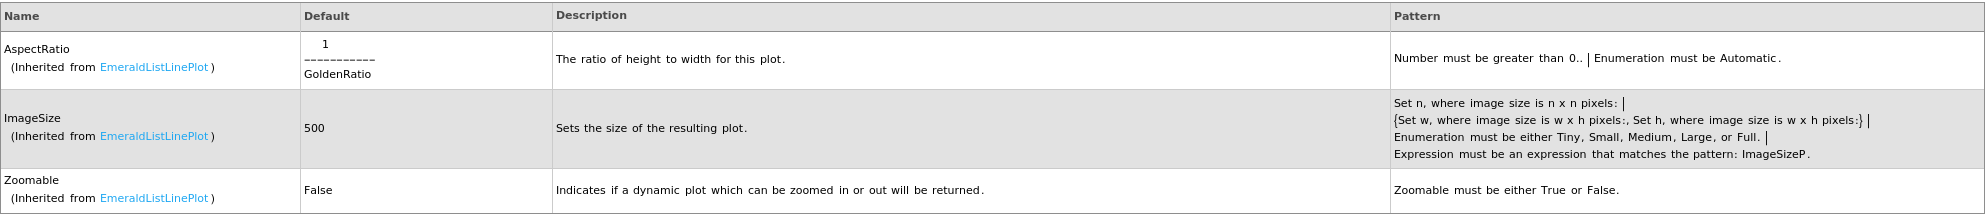
Image Format Options
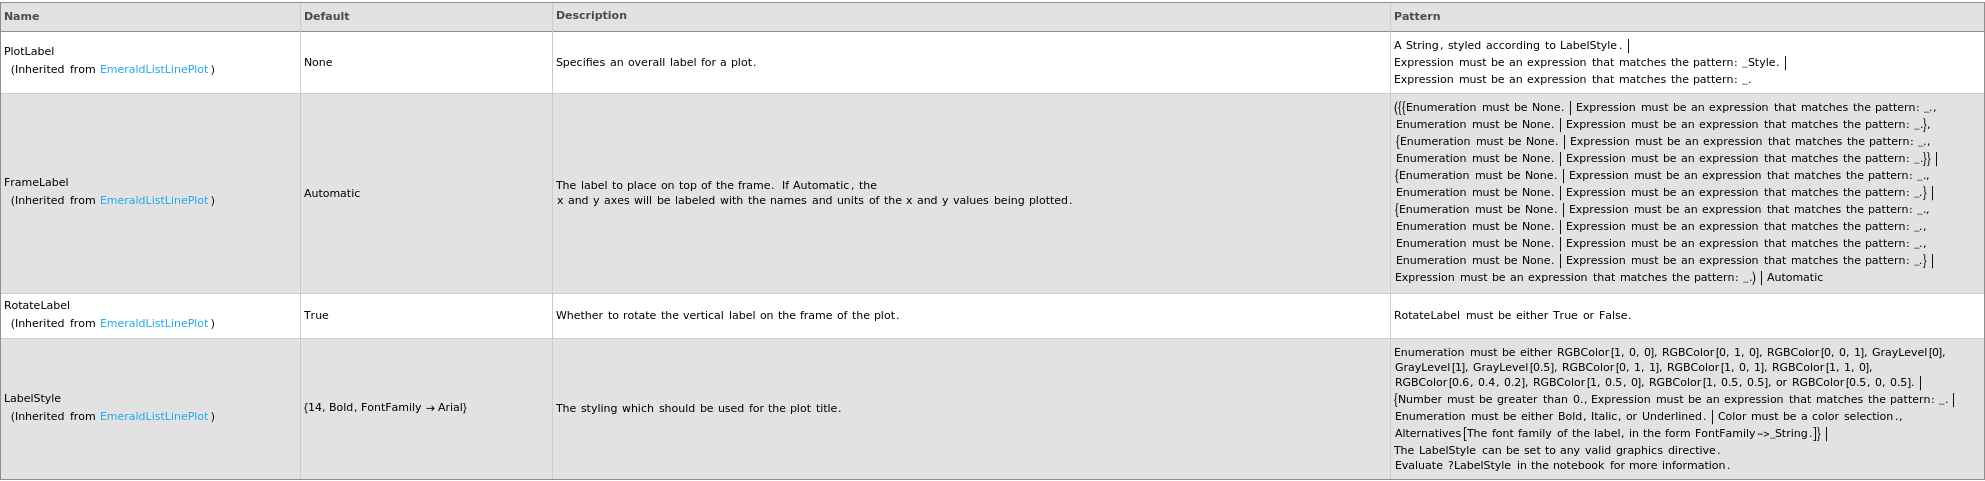
Plot Labeling Options
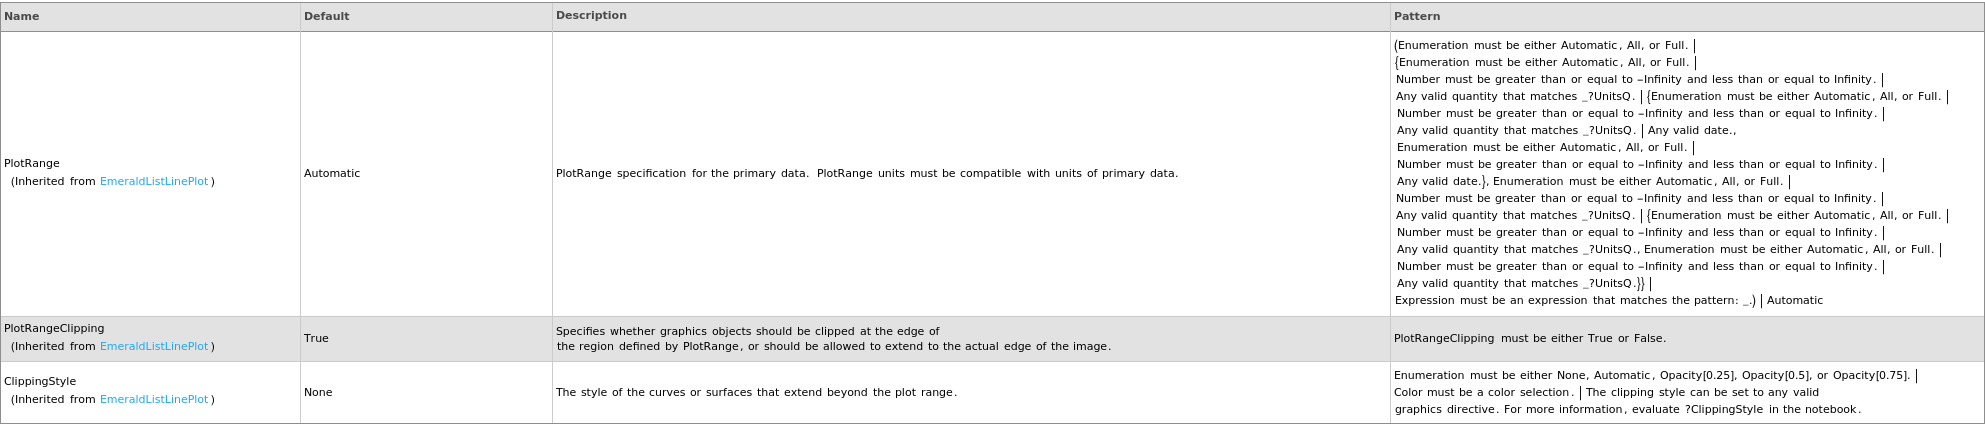
Plot Range Options
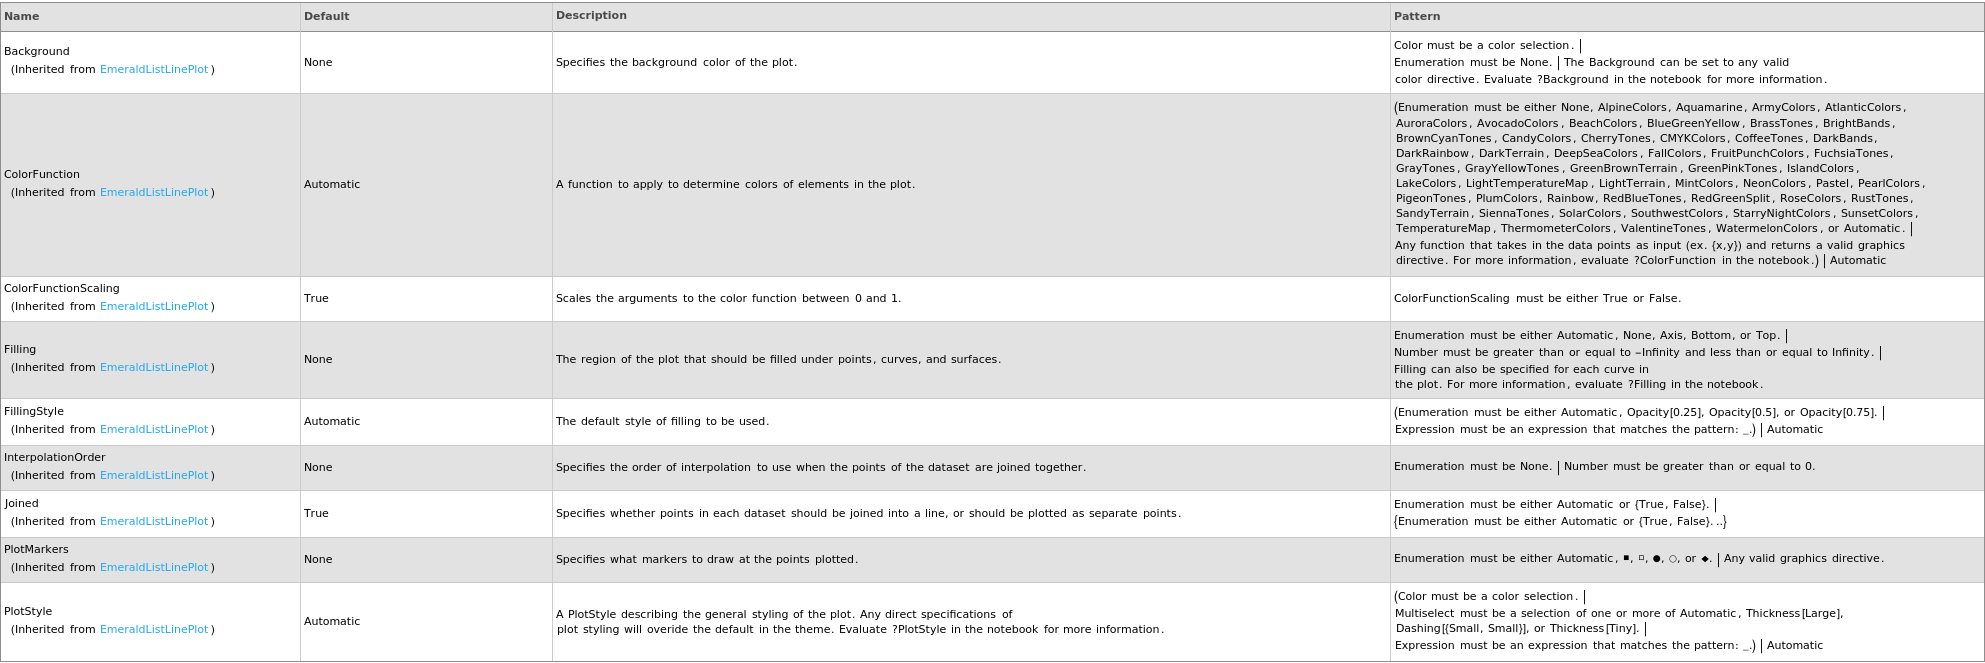
Plot Style Options
Probes Options

General Options

Examples
open allclose allBasic Examples (2)
Given the output from SimulateProbeSelection, the funcion plots the probe accessibility along a target, arrows represent selected top probes with their rank indicated:
The function can also work on Object[Simulation, PrimerSet] by plotting out forward primers (left arrows), reverse primers (right arrows) and Beacons (horizontal lines):
Options (1)


Last modified on Fri 19 Sep 2025 09:57:01