PlotAbsorbanceKinetics
PlotAbsorbanceKinetics[SpectroscopyObjects]⟹Plot
provides a graphical plot of the trajectory stored in the object SpectroscopyObjects.
PlotAbsorbanceKinetics[Protocol]⟹Plot
creates a Plot of the trajectory values in the data objects found in the Data field of Protocol.
PlotAbsorbanceKinetics[Spectrum]⟹Plot
provides a graphical plot of the provided spectrum.
Details
Input

Output

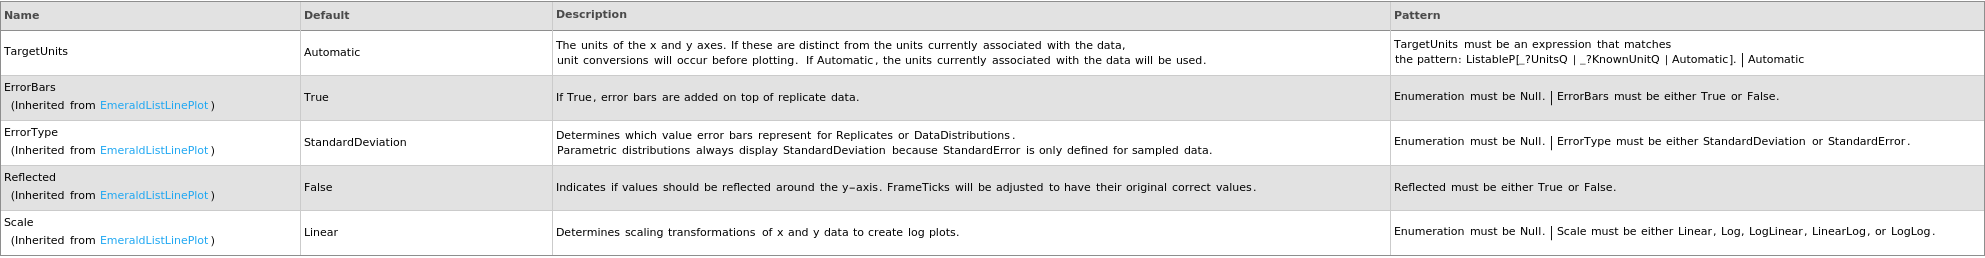
Data Specifications Options
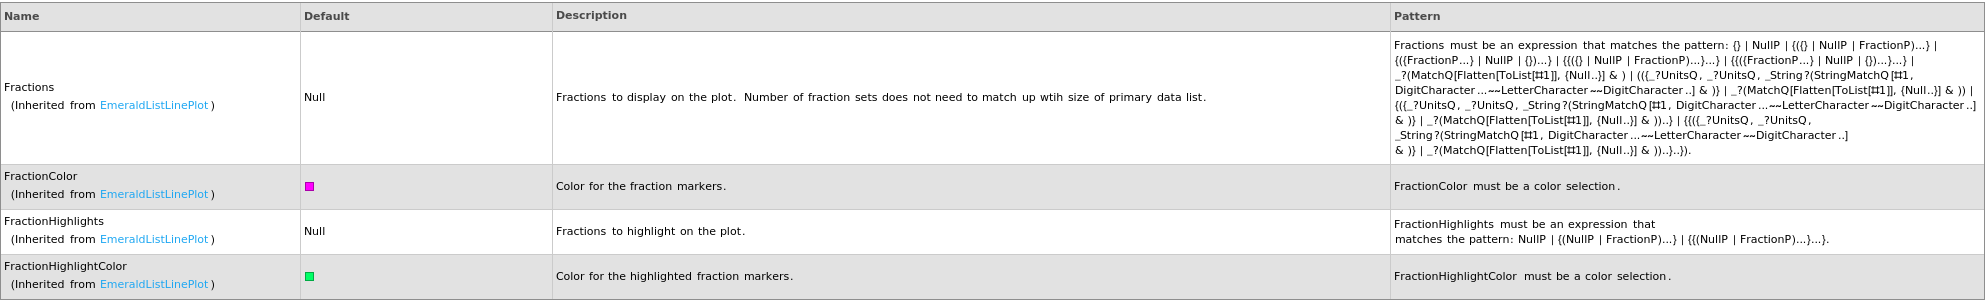
Fractions Options
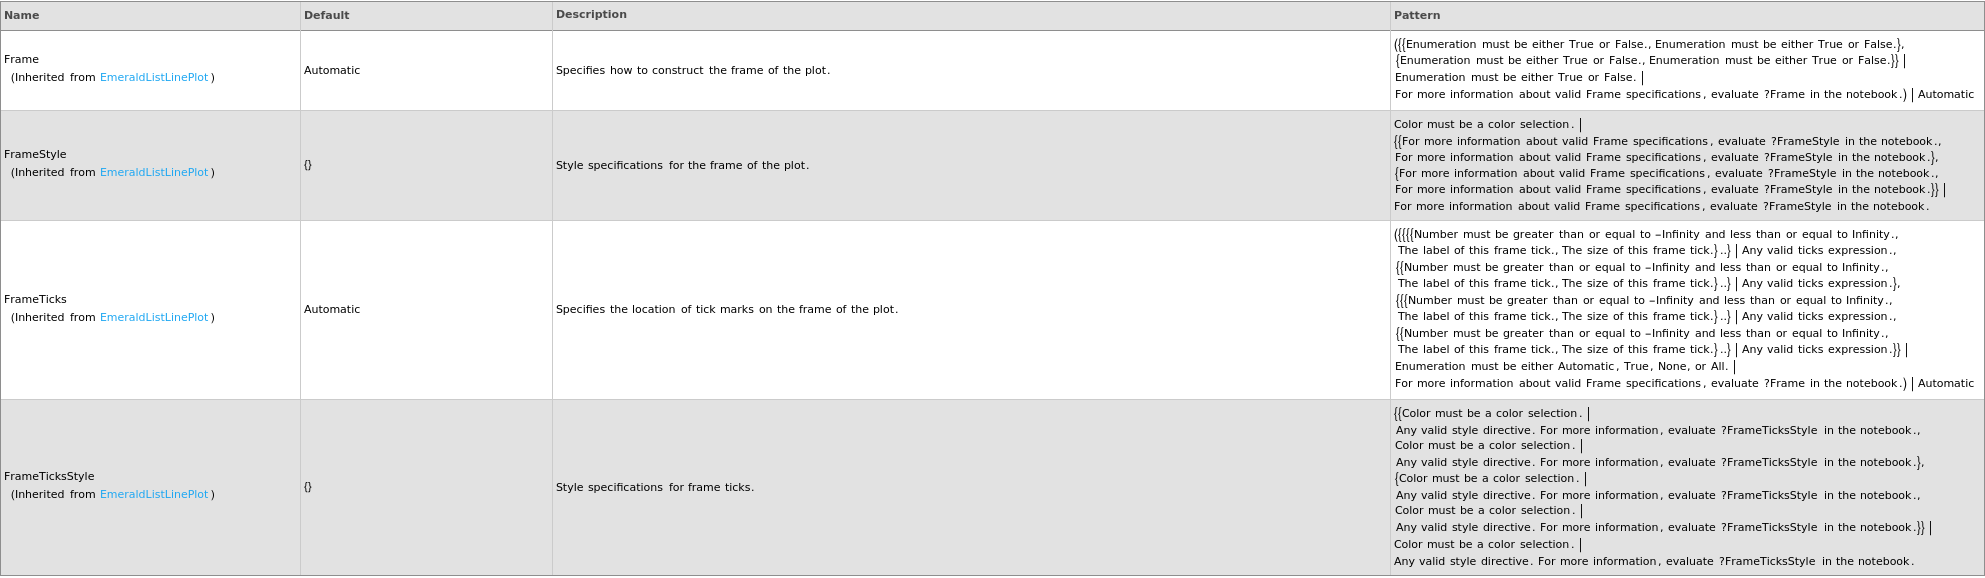
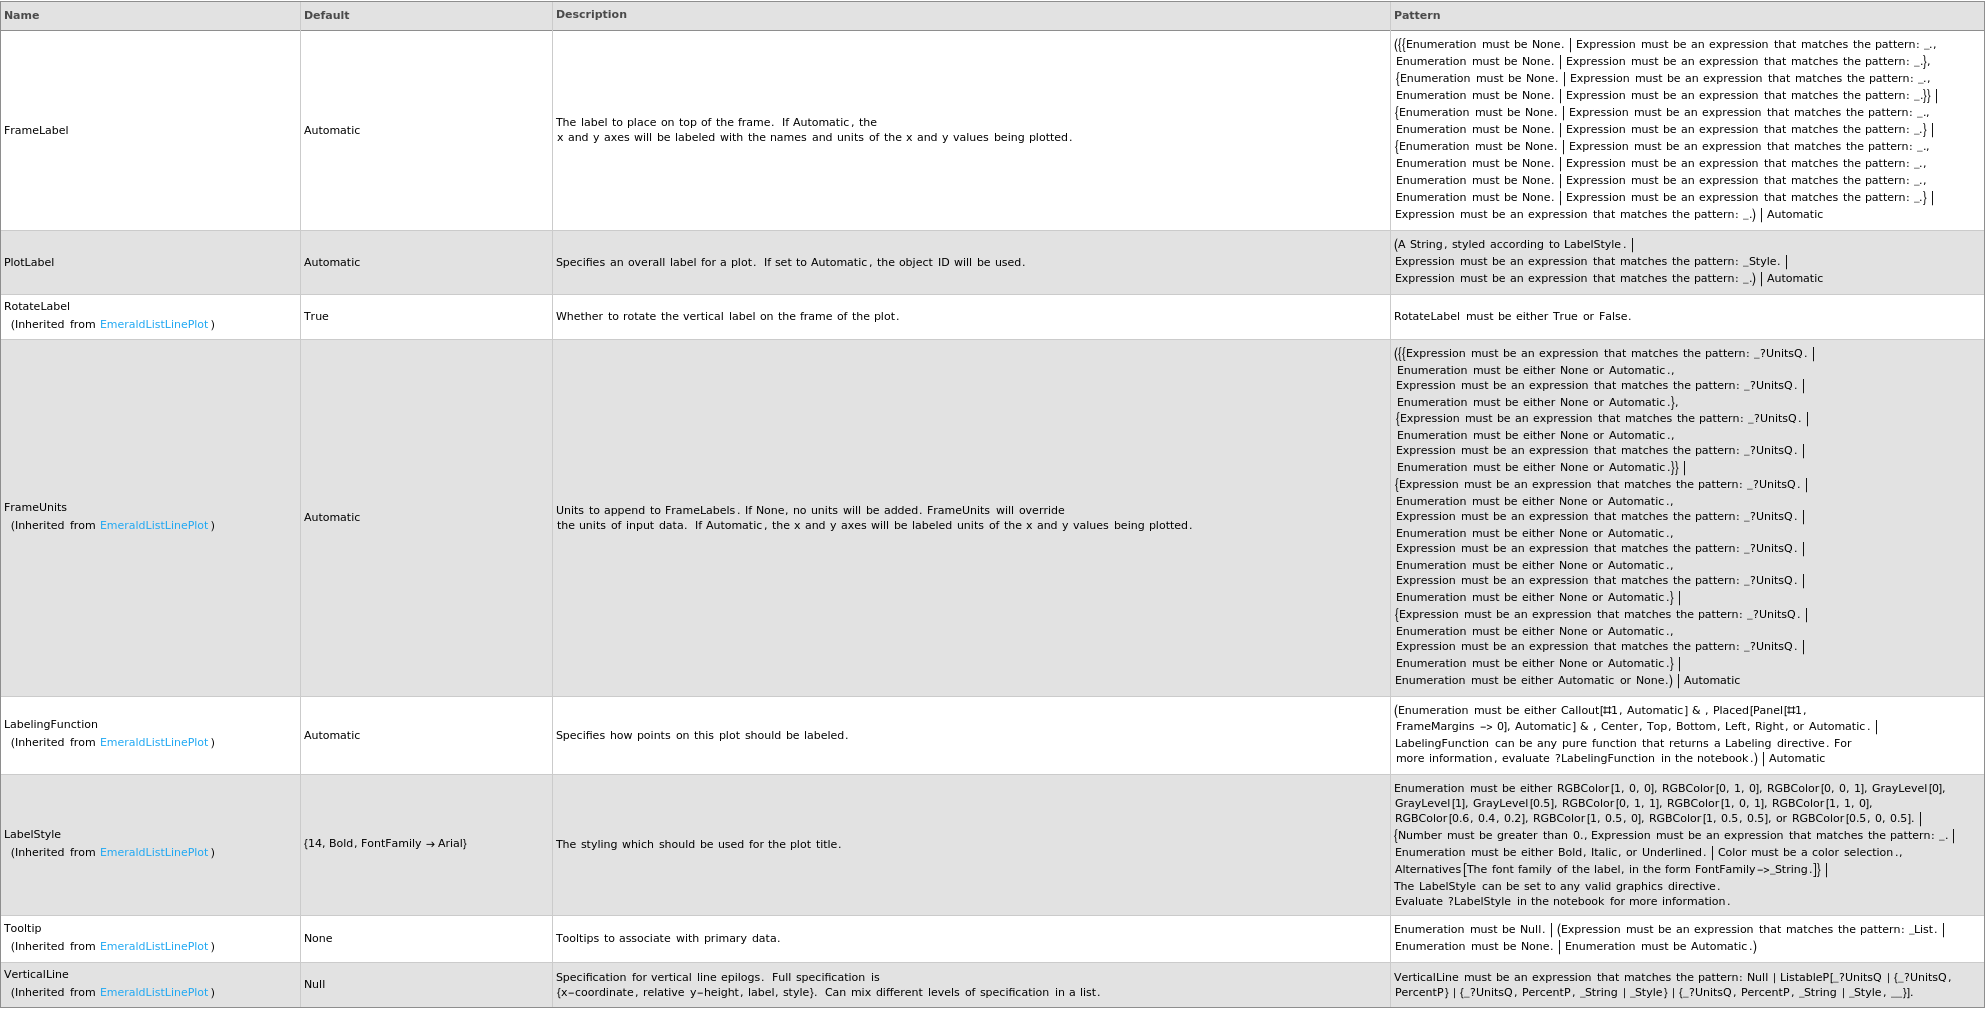
Frame Options
Grid Options
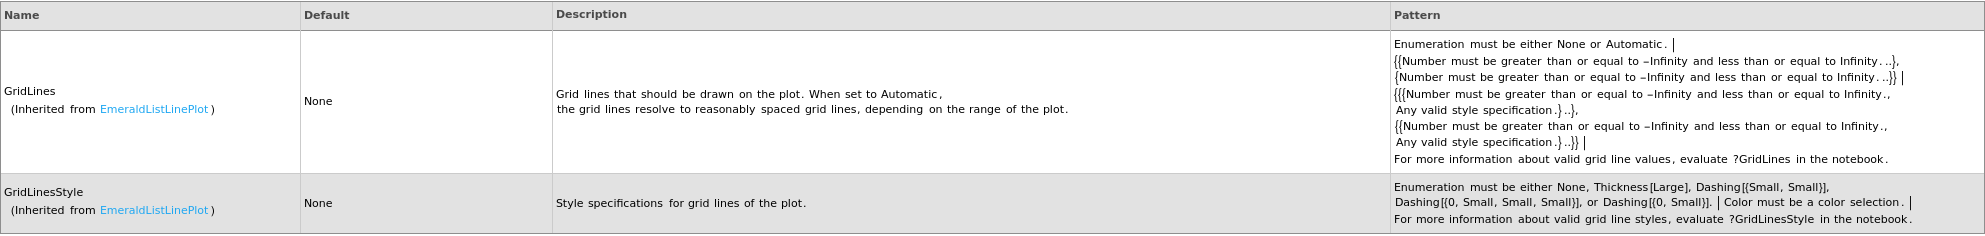
Image Format Options

Ladder Options

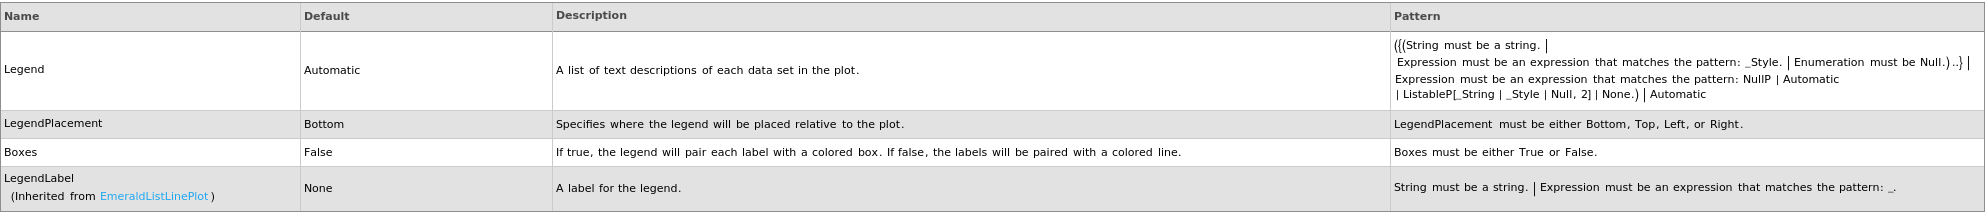
Legend Options
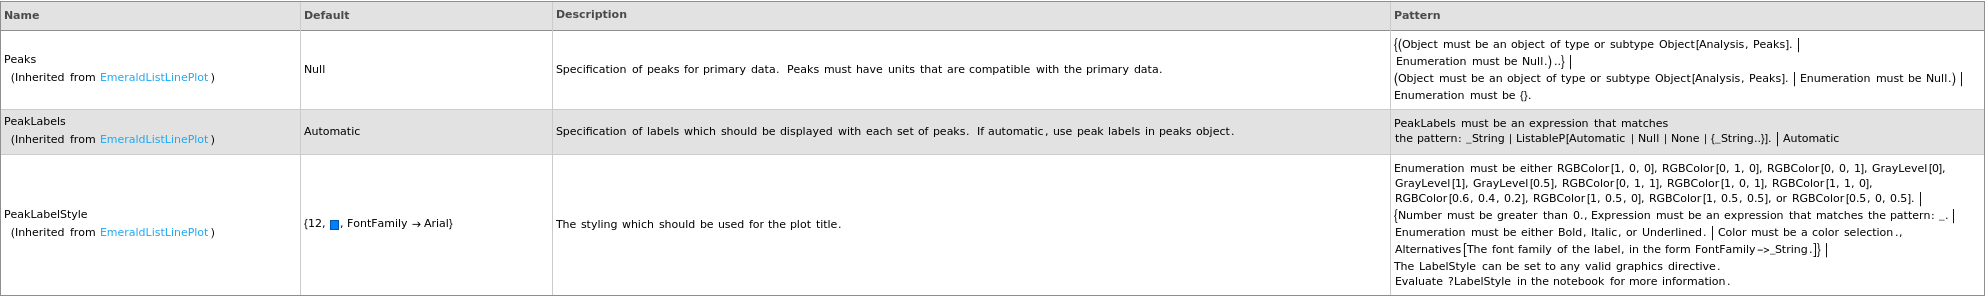
Peaks Options
Plot Labeling Options
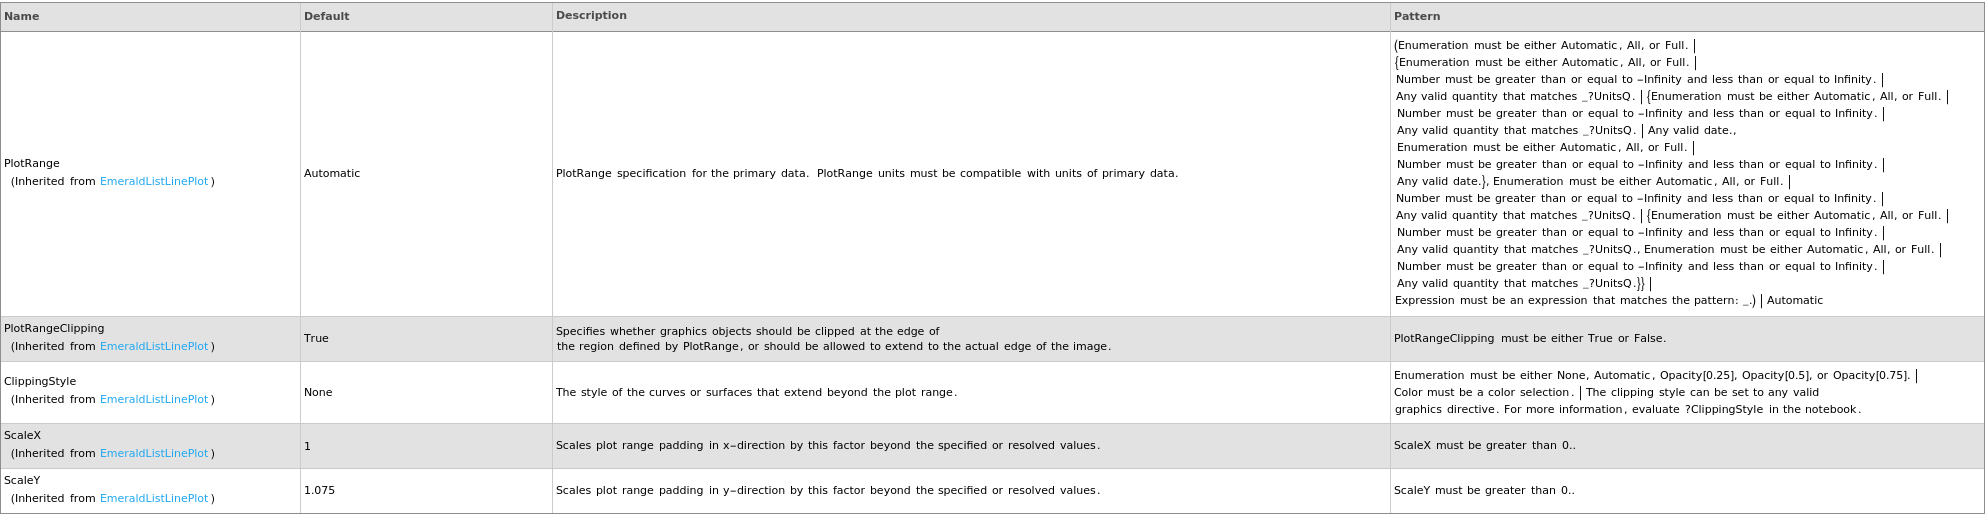
Plot Range Options
Plot Style Options
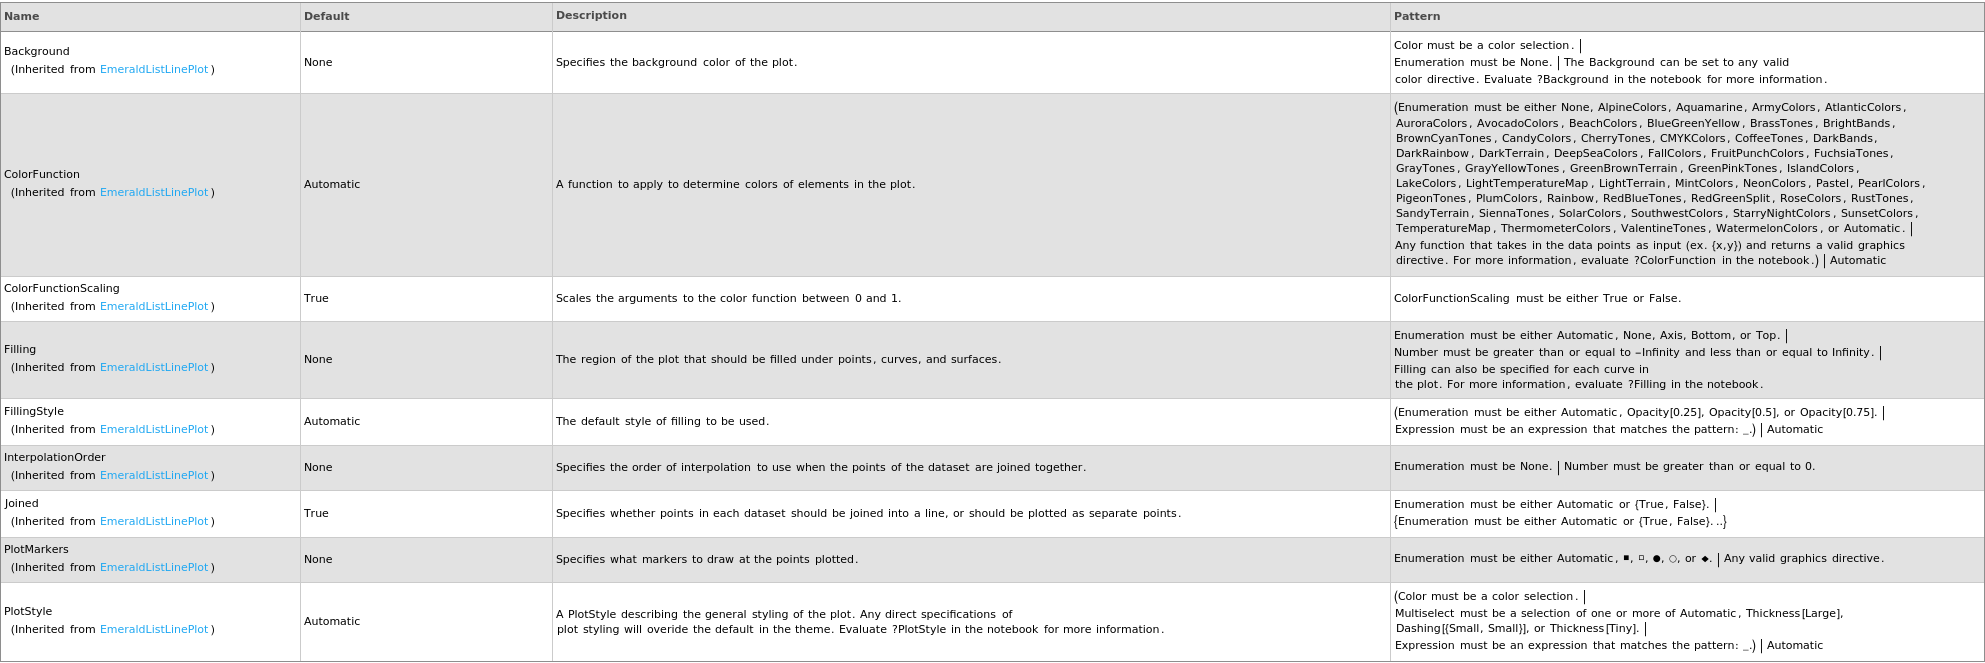
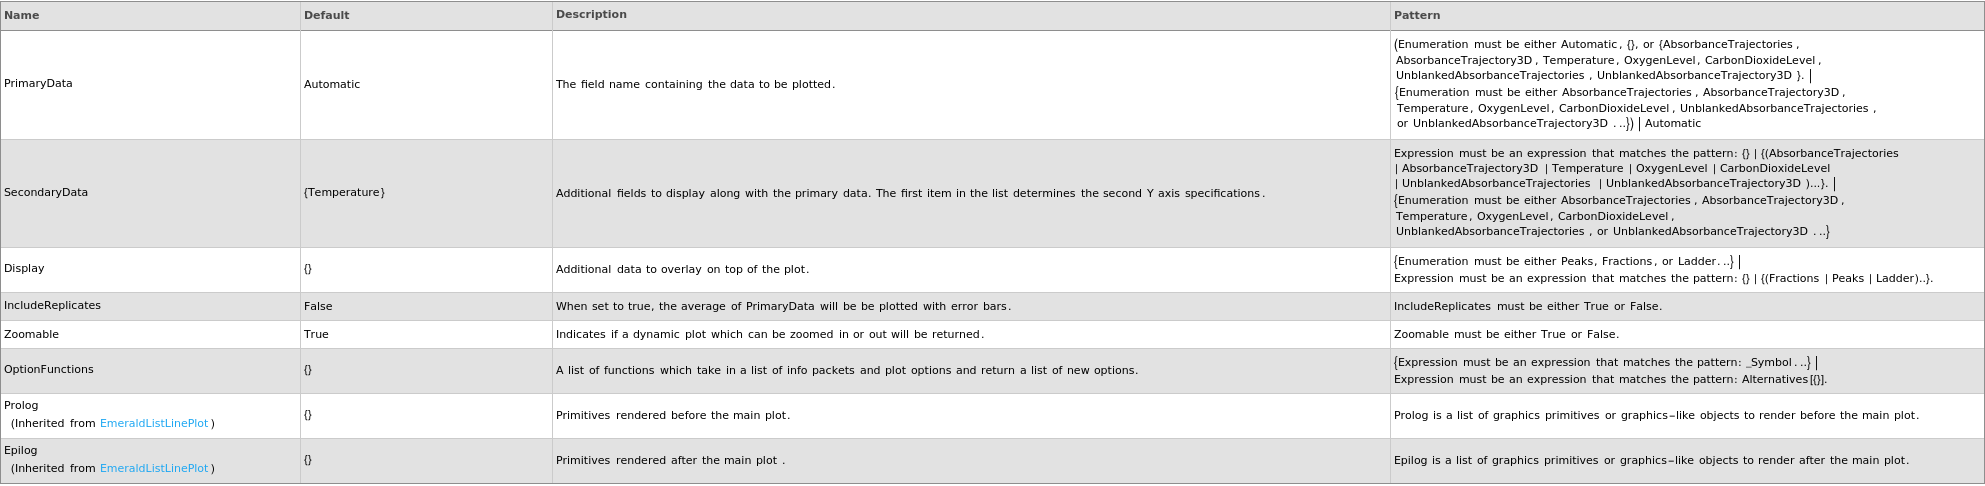
Primary Data Options

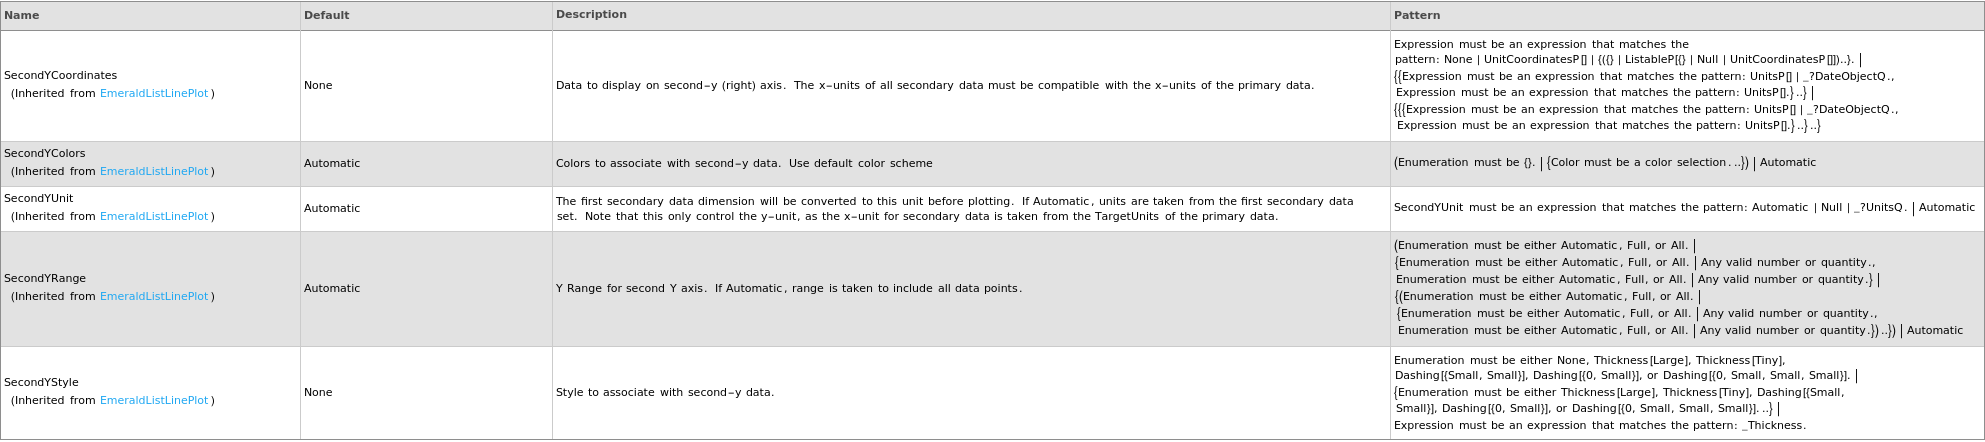
Secondary Data Options
General Options
Examples
open allclose allBasic Examples (5)
Plots absorbance kinetics data when given a list of XY coordinates representing the spectra:
Plots absorbance kinetics data when given an AbsorbanceKinetics data link:
Plots data objects linked to a protocol when given an AbsorbanceKinetics protocol object:
Plots multiple sets of data on the same graph:
Plots the absorbance trajectory in an AbsorbanceKinetics data object: