PlotCircularDichroism
PlotCircularDichroism[SpectroscopyObjects]⟹Plot
provides a graphical plot of spectra belonging to SpectroscopyObjects.
PlotCircularDichroism[Protocol]⟹Plot
creates a Plot of spectra in the data objects found in the Data field of Protocol.
PlotCircularDichroism[Spectrum]⟹Plot
provides a graphical plot of the provided spectrum.
Details
Input

Output

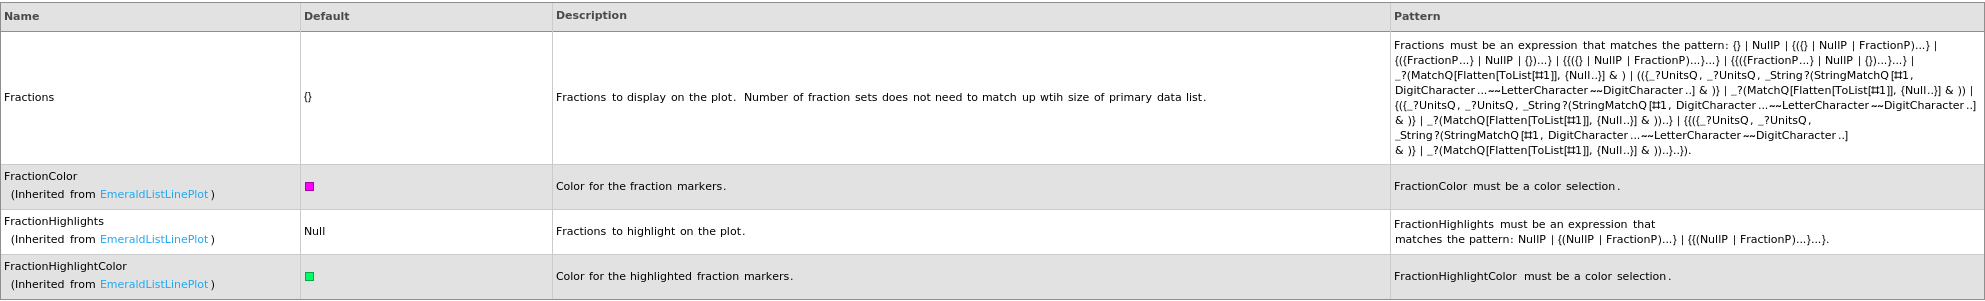
Fractions Options
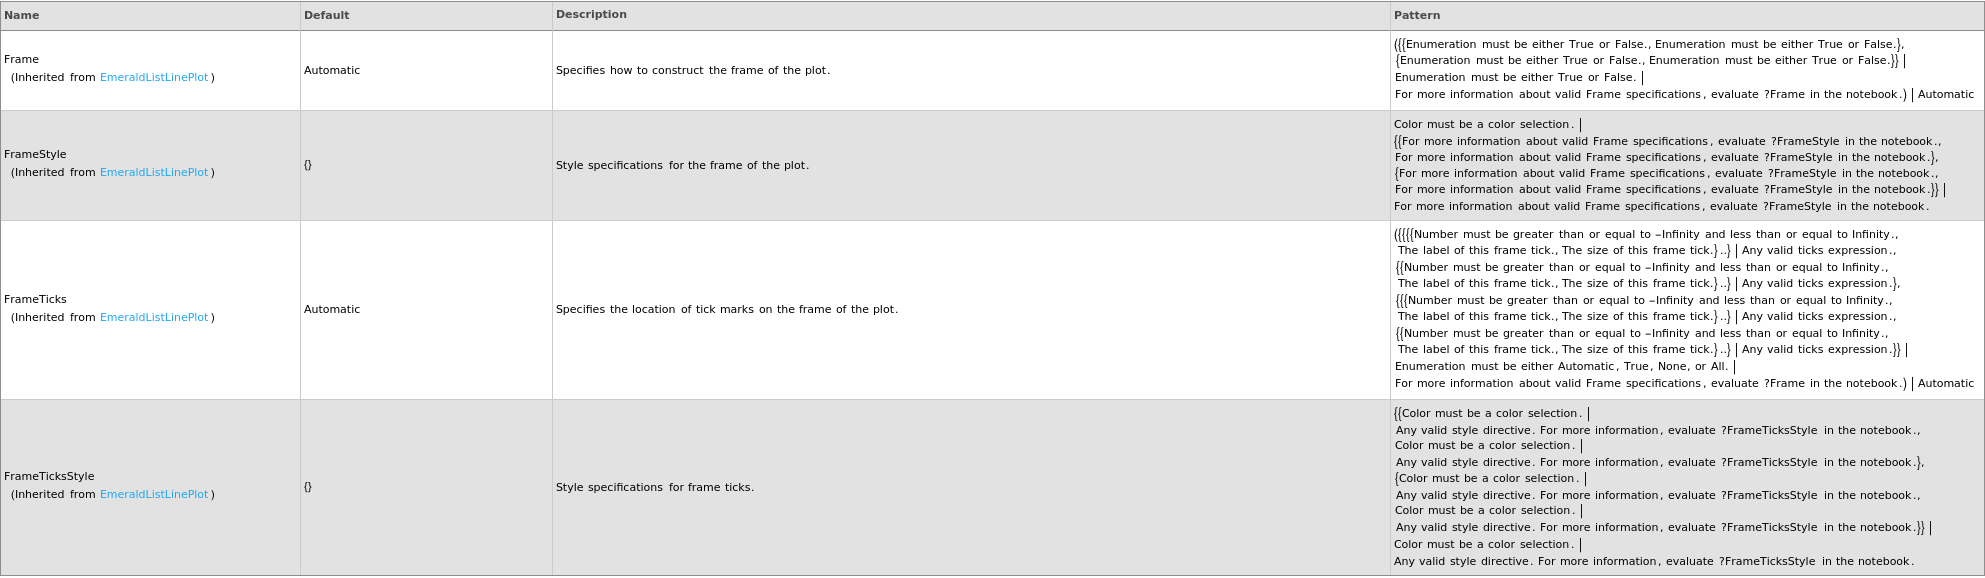
Frame Options
Grid Options
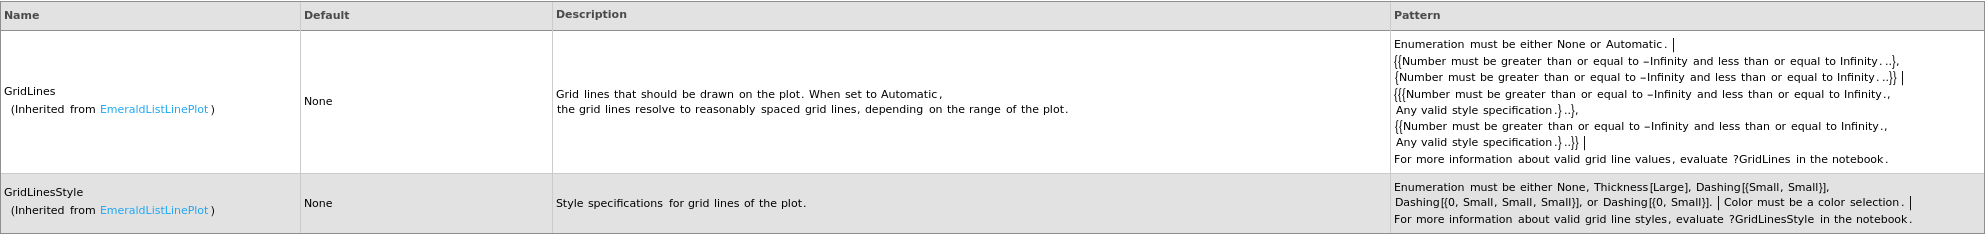
Image Format Options

Ladder Options

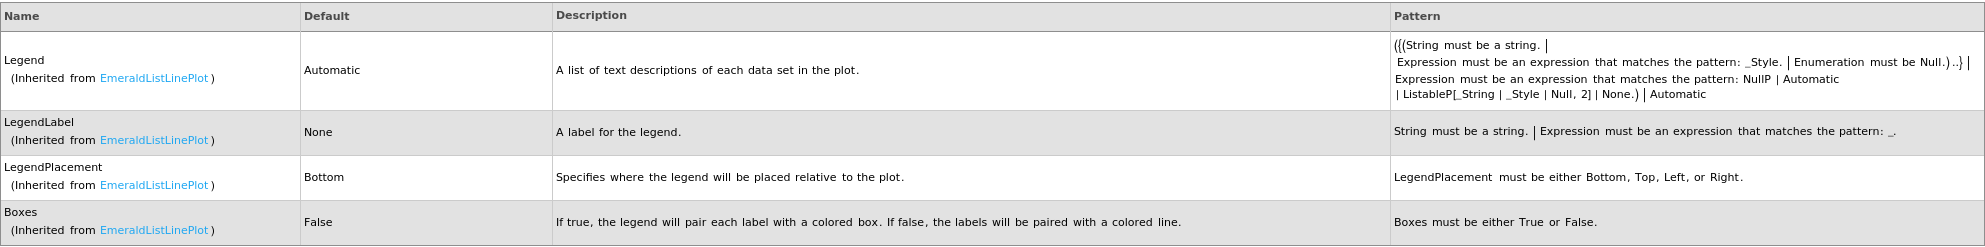
Legend Options
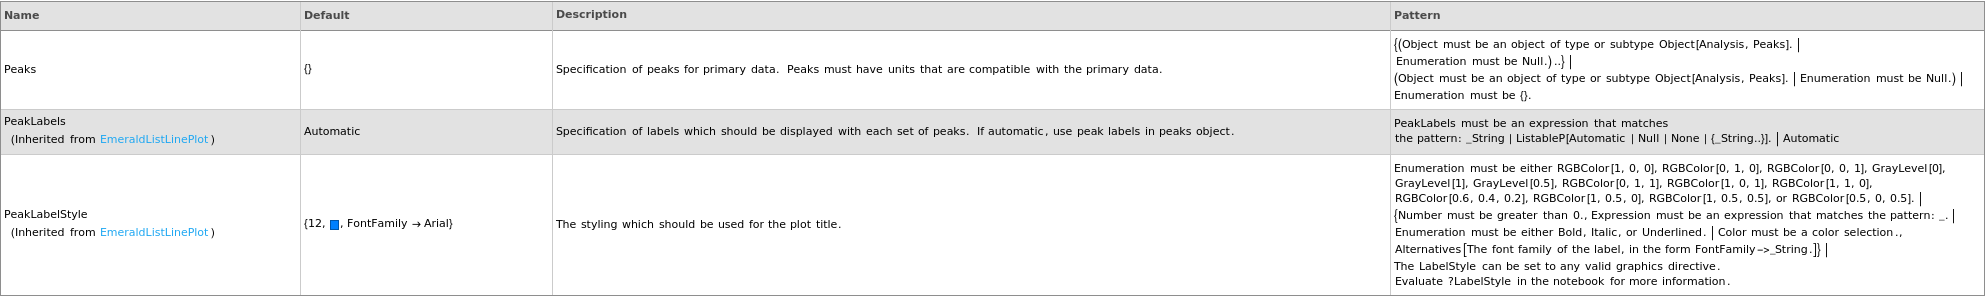
Peaks Options
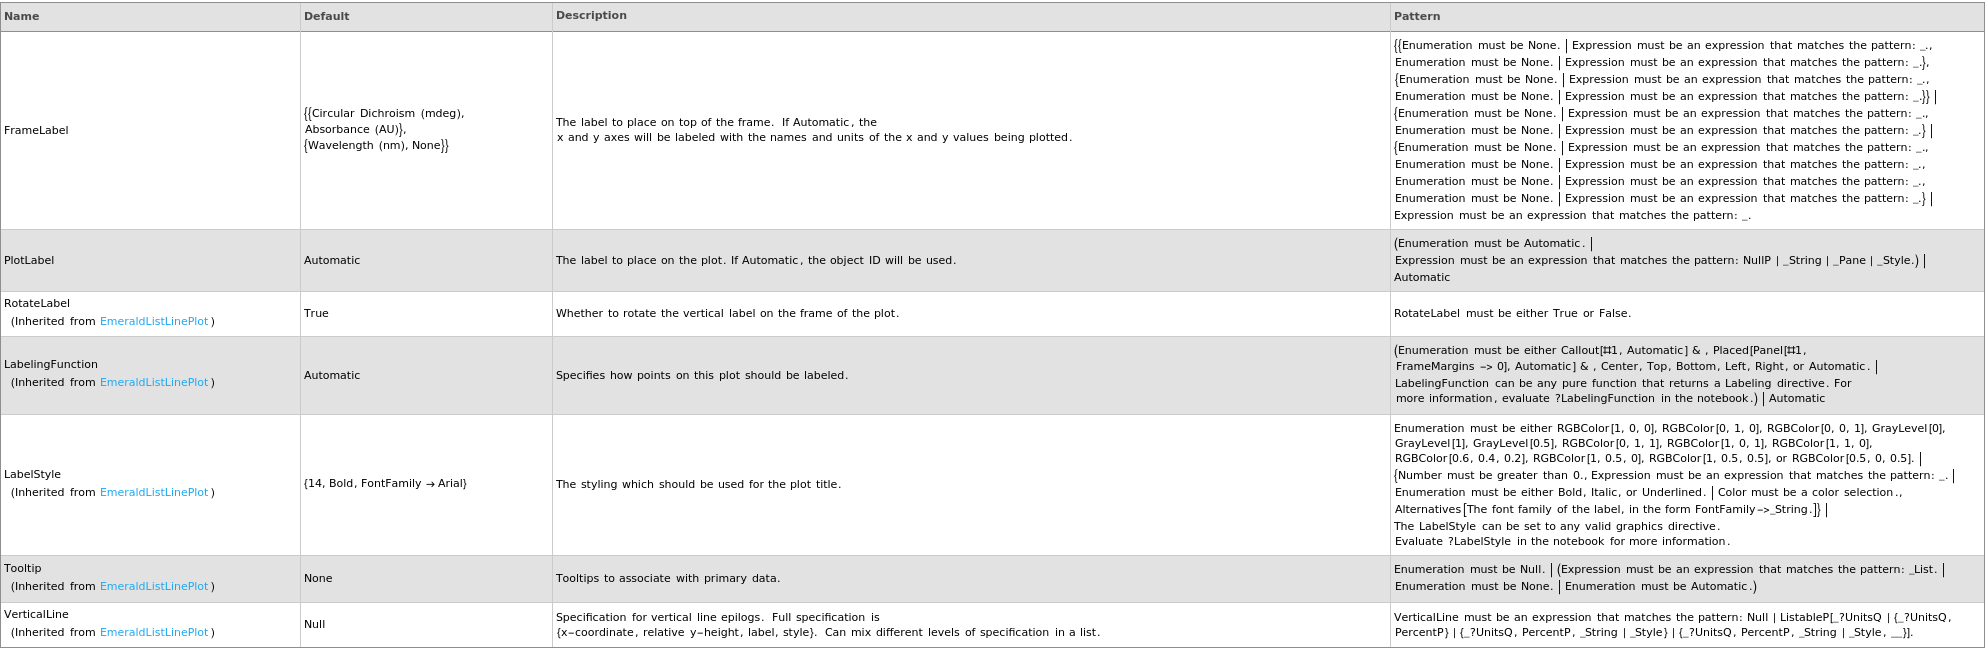
Plot Labeling Options
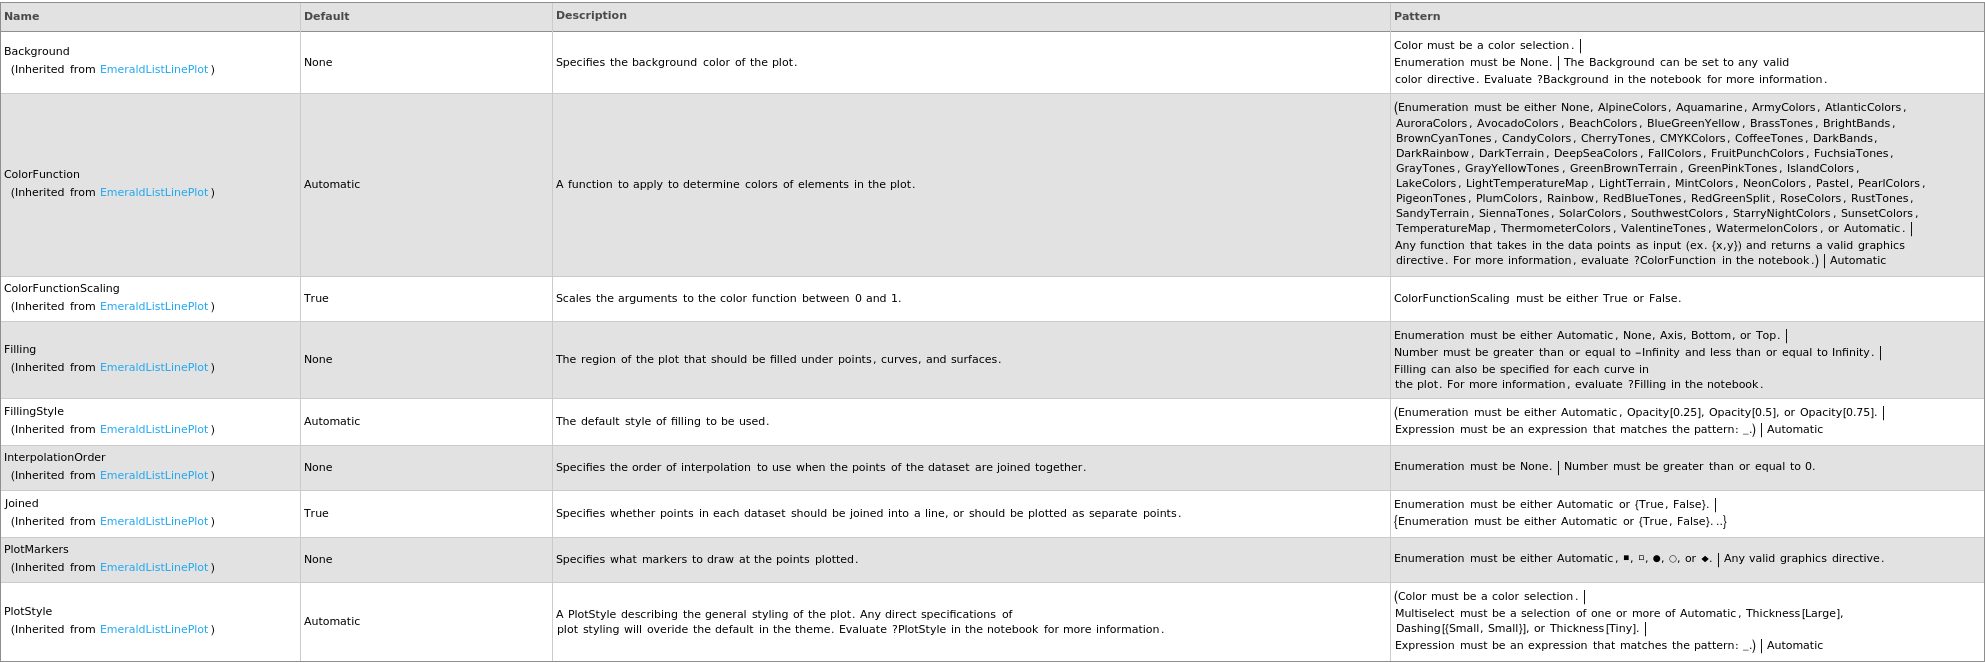
Plot Style Options
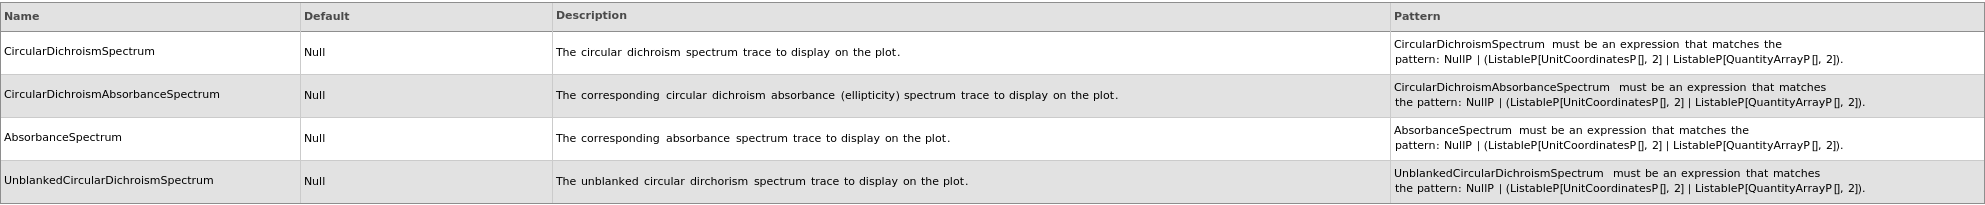
Primary Data Options

Raw Data Options
Secondary Data Options
General Options

Examples
open allclose allBasic Examples (5)
Plots circular dichroism spectroscopy data when given a CircularDichroism data link:
Plots circular dichroism spectroscopy data when given a CircularDichroism data object:
Plots circular dichroism spectroscopy data when given a CircularDichroism protocol object:
Plots circular dichroism spectroscopy data when given a list of XY coordinates representing the spectra:
Options (23)
AbsorbanceSpectrum (1)
Boxes (1)
CircularDichroismAbsorbanceSpectrum (1)
CircularDichroismSpectrum (1)
Display (1)
OptionFunctions (1)
Overlay (2)
Peaks (1)
PlotTheme (1)
PrimaryData (1)
SecondaryData (1)
UnblankedCircularDichroismSpectrum (1)
Messages (5)
CircularDichroismProtocolDataNotPlotted (4)


Last modified on Thu 21 Aug 2025 15:24:06