PlotStandardCurve
PlotStandardCurve[StandardCurve]⟹Plot
plots a fitted standard curve alongside the data points it was applied to.
Details
- PlotStandardCurve inherits options from EmeraldListLinePlot. Please see the documentation for EmeraldListLinePlot for more examples.
Input

Output

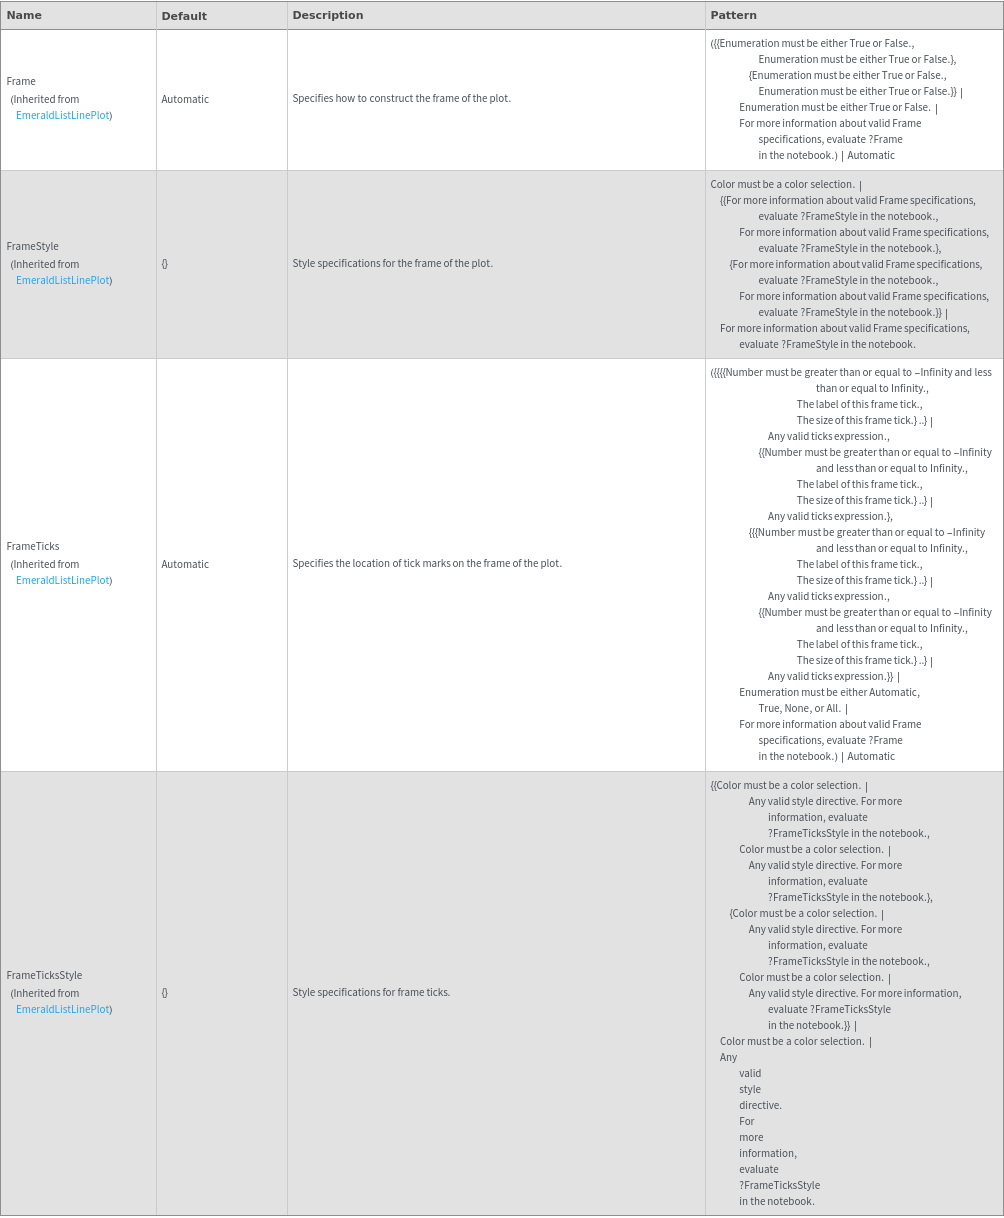
Frame Options
Grid Options
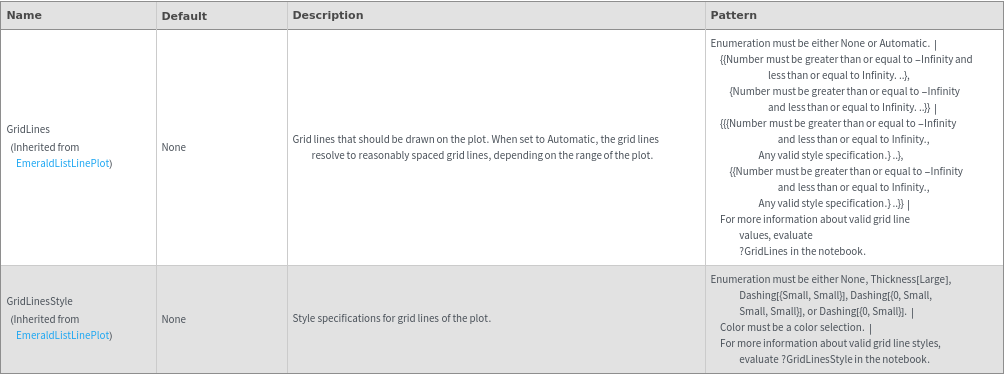
Image Format Options

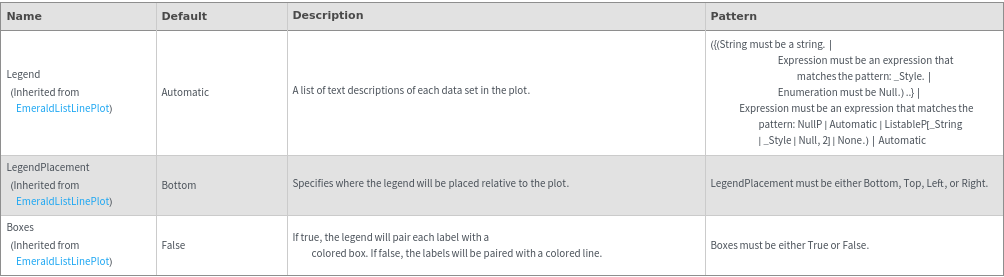
Legend Options
Plot Labeling Options

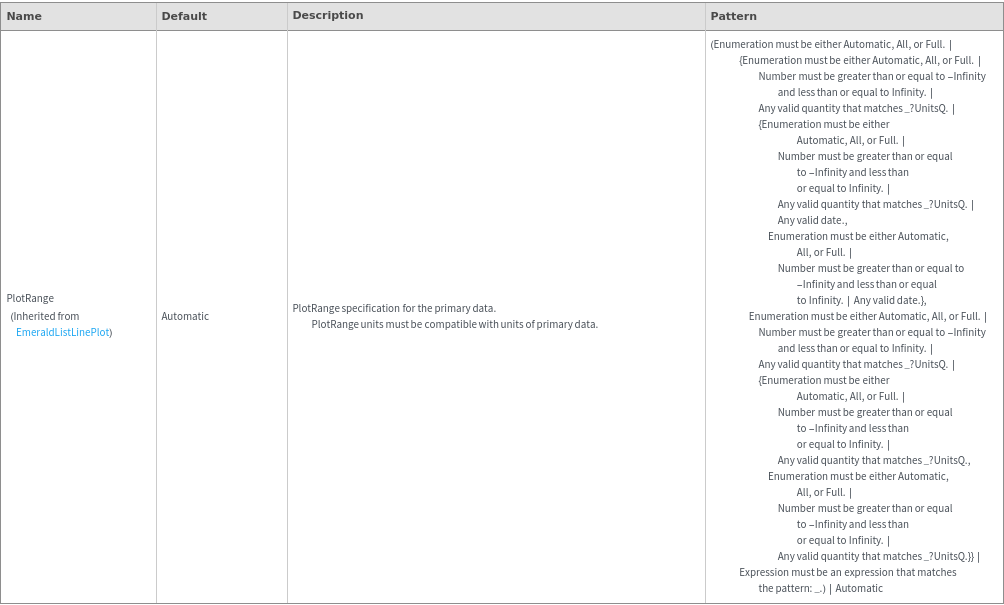
Plot Range Options
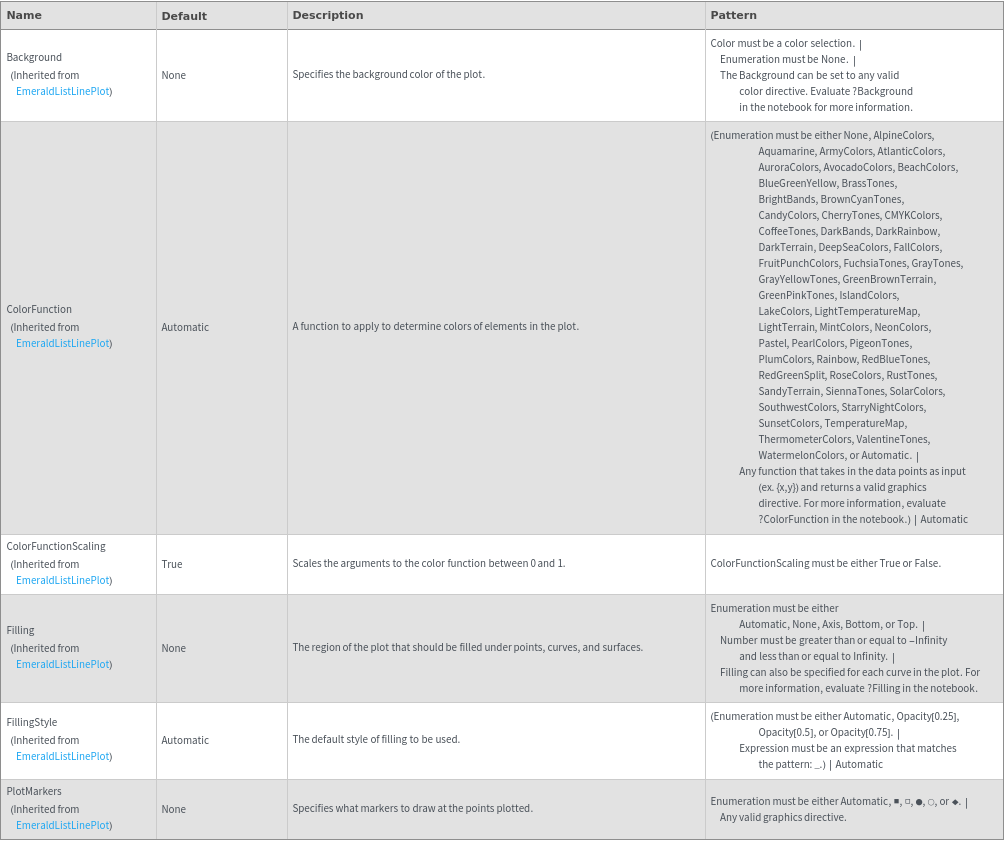
Plot Style Options
General Options
Examples
Example Setup
These expressions are used in the examples to follow:
Basic Examples (3)
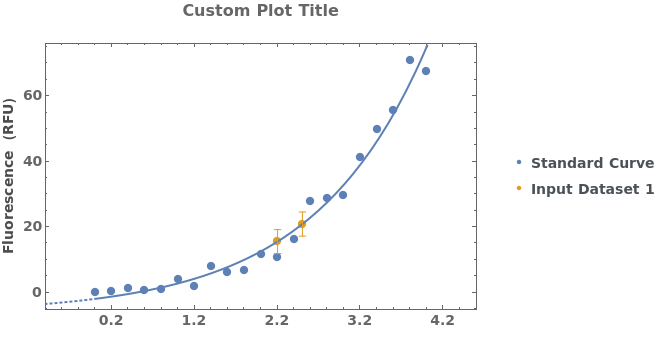
Add a frame and a title to the plot of a standard curve analysis:
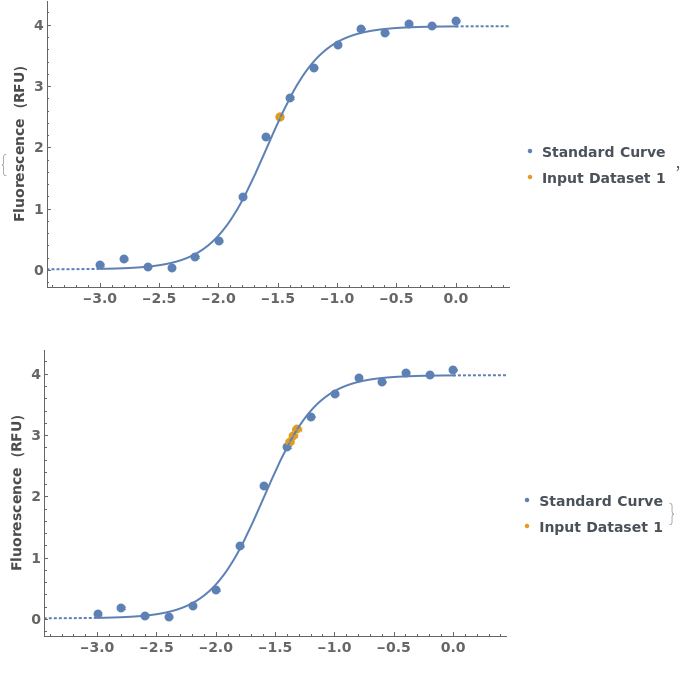
Given a list of standard curve analyses, generate a list of standard curve plots:
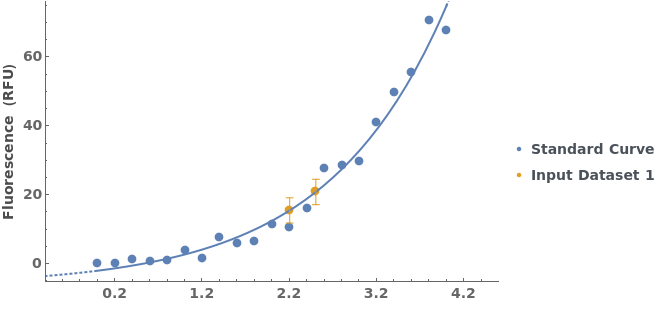
Plot the results of a standard curve analysis:
Last modified on Mon 26 Aug 2024 10:13:55