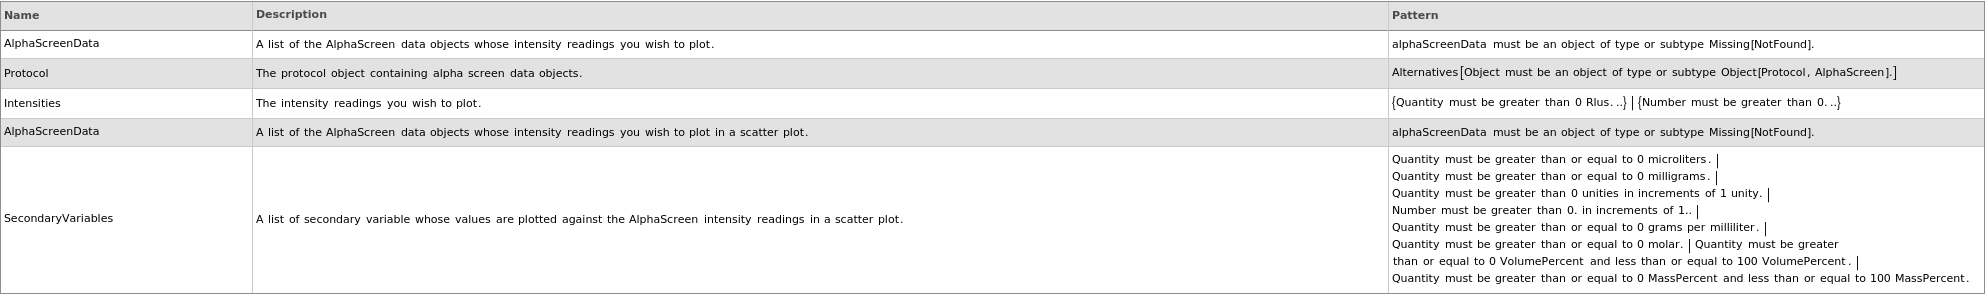
PlotAlphaScreen
PlotAlphaScreen[AlphaScreenData]⟹Plot
provides a graphical plot of the provided luminescence intensities either in the form of a histogram or a box and whisker plot.
PlotAlphaScreen[Protocol]⟹Plot
creates a Plot of the luminescence intensities in the data objects found in the Data field of Protocol.
PlotAlphaScreen[Intensities]⟹Plot
provides a graphical plot the provided luminescence intensities either in the form of a histogram or a box and whisker plot.
PlotAlphaScreen[AlphaScreenData,SecondaryVariables]⟹Plot
provides a graphical plot the provided luminescence intensities (in y-axis) against the values of secondary variable (in x-axis) in the form of a scatter plot.
PlotAlphaScreen[Intensities,SecondaryVariables]⟹Plot
provides a graphical plot the provided luminescence intensities (in y-axis) against the values of secondary variable (in x-axis) in the form of a scatter plot.
Details
Input
Output

Data Processing Options

Data Specifications Options
Fractions Options
Frame Options
Grid Options
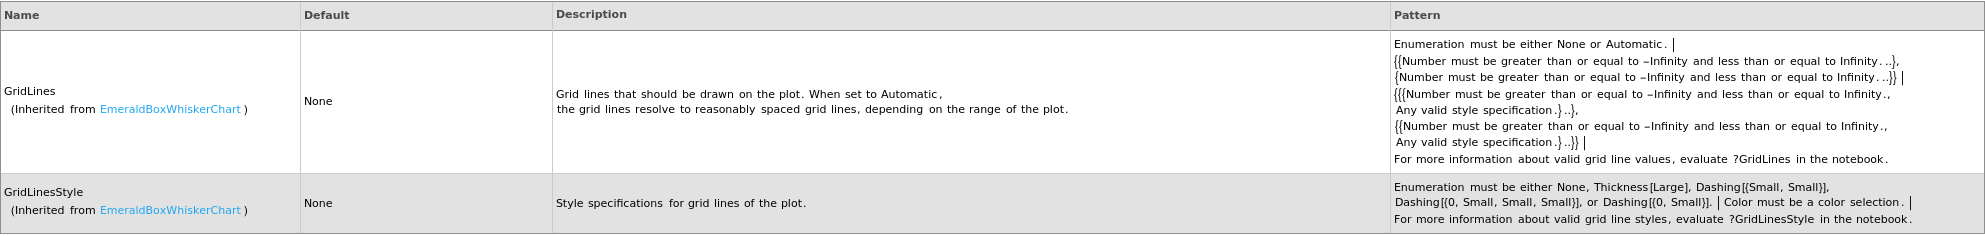
Image Format Options
Ladder Options

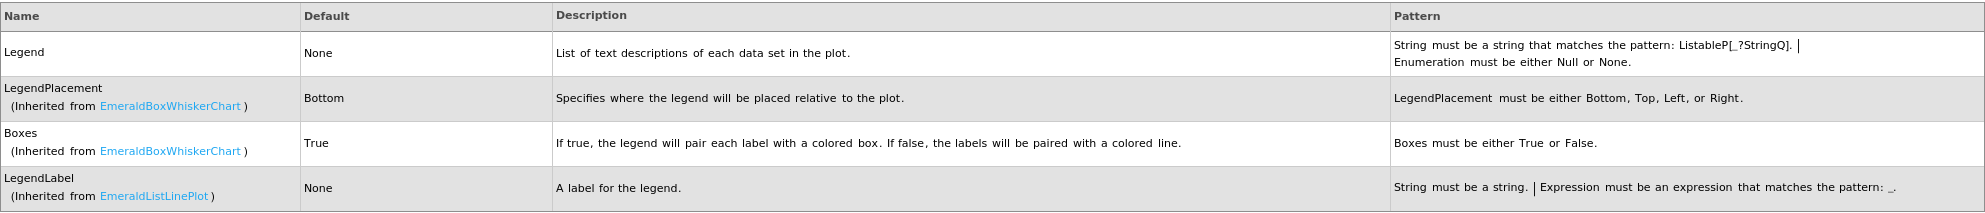
Legend Options
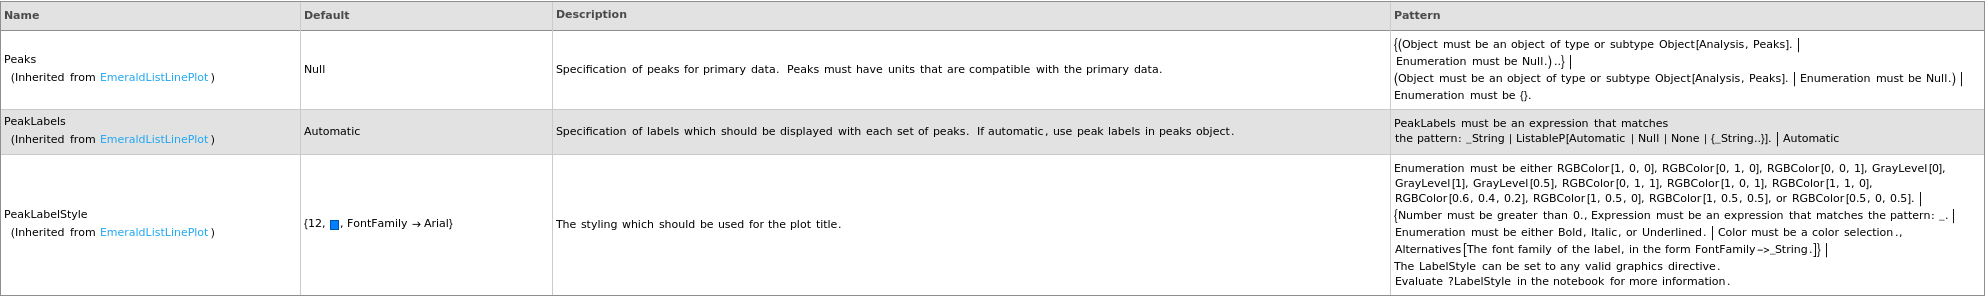
Peaks Options
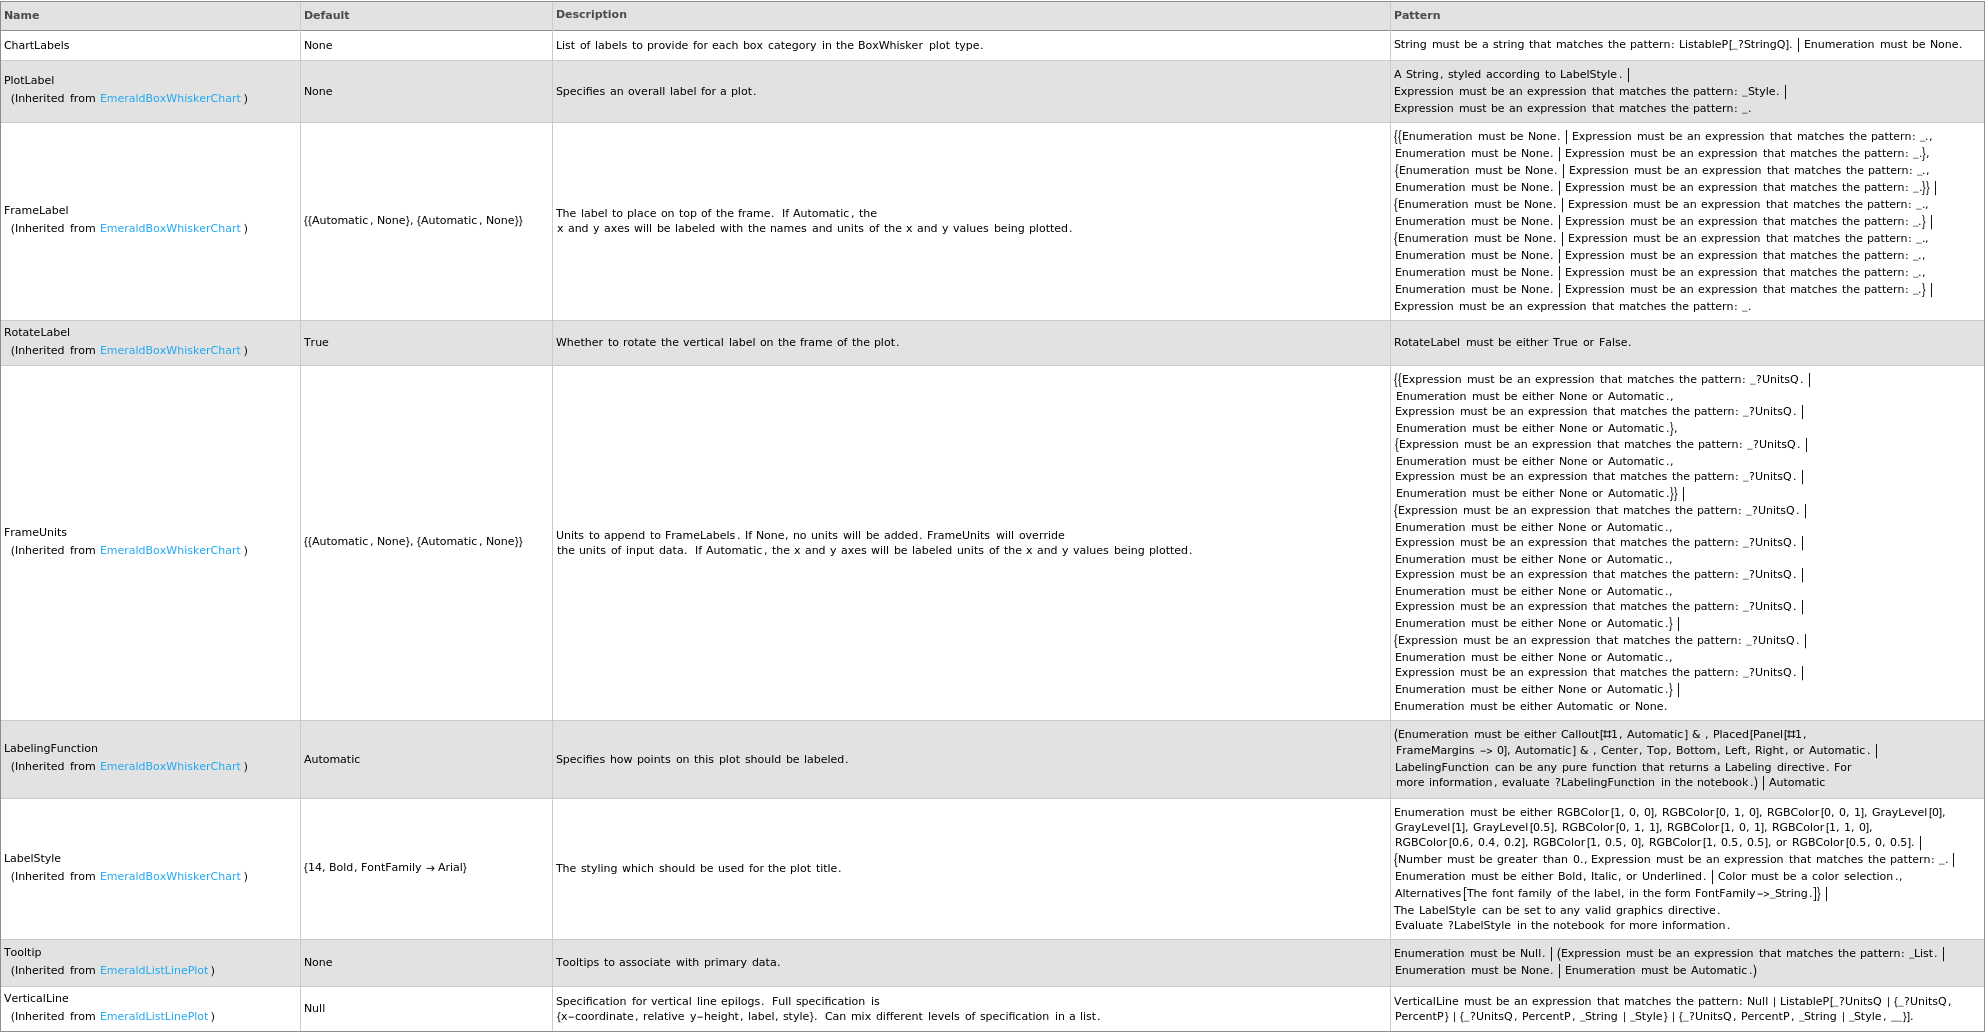
Plot Labeling Options
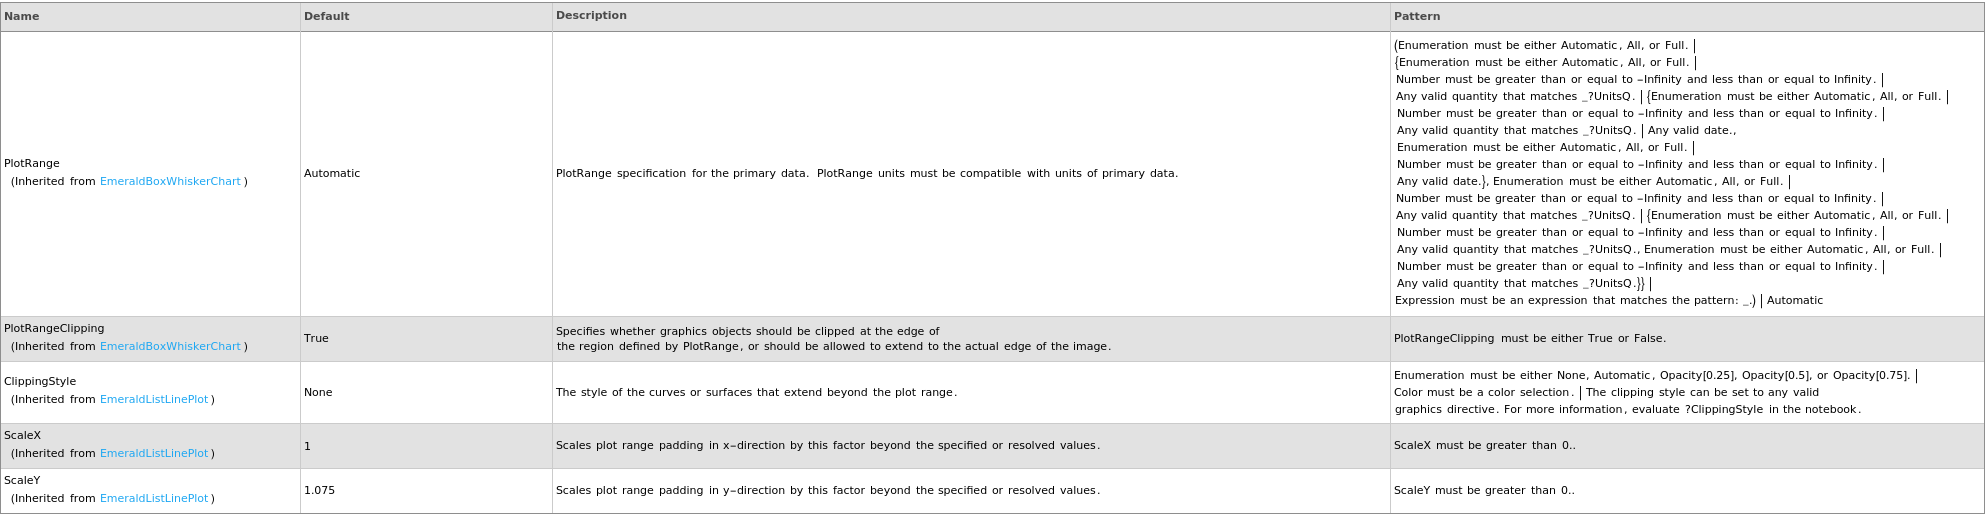
Plot Range Options
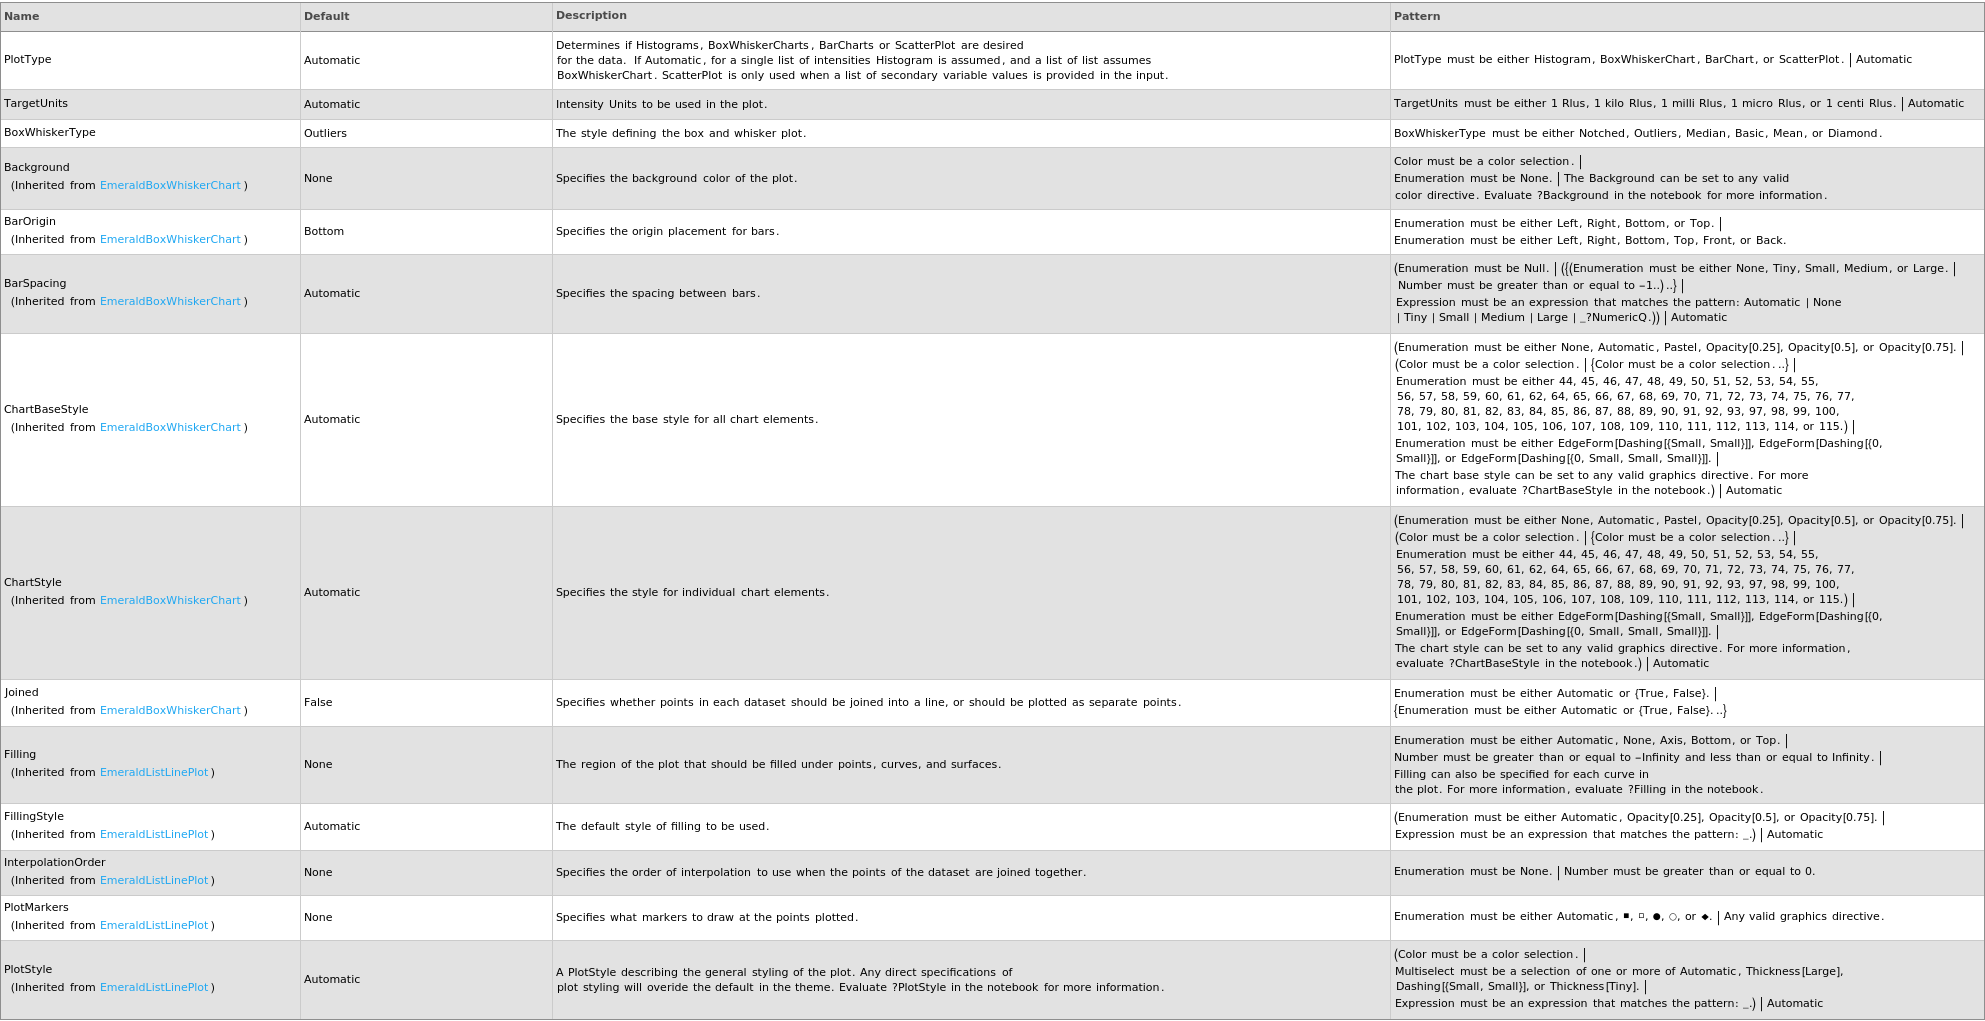
Plot Style Options
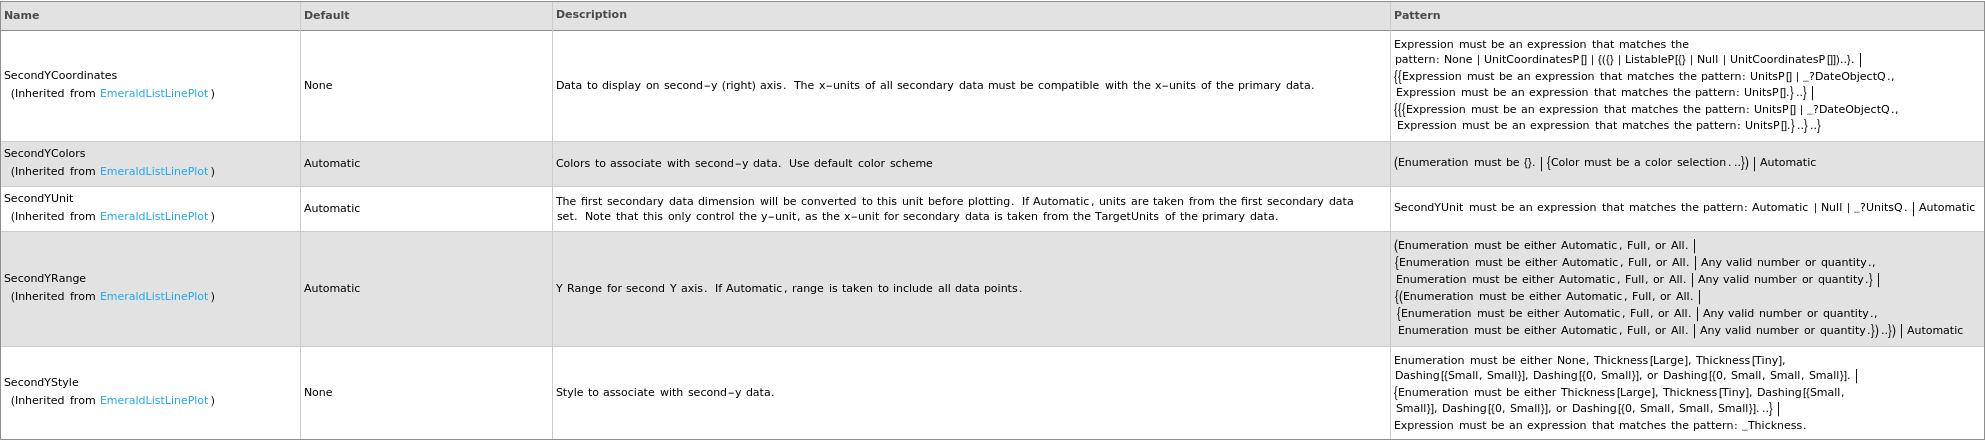
Secondary Data Options
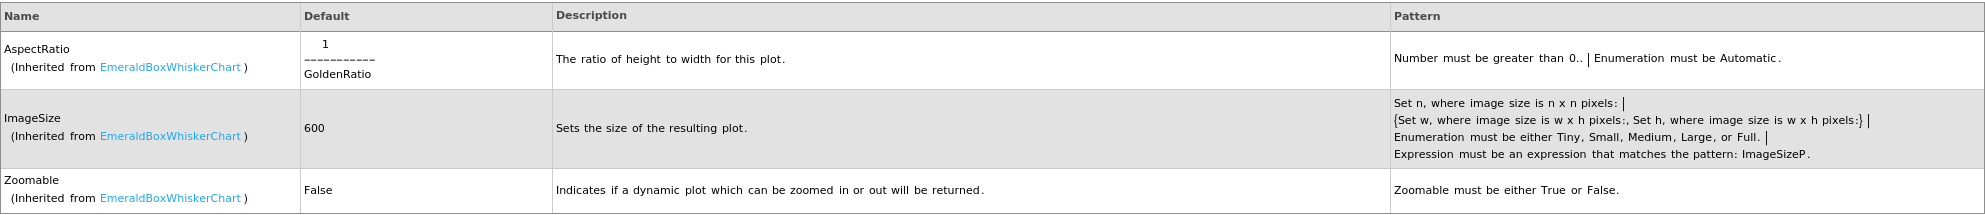
General Options
